Flow Editor
The Flow Editor is where you edit, run, and debug a flow. One editor serves every place a flow can come from: Dataverse flows, flows that are not stored in Dataverse, the Flow Workspace, and files in a Local Folder. You open it by clicking a flow on any of the lists described in Solutions and Flows.
| Route | Flow source |
|---|---|
/flows/:flowId | A Dataverse flow (from Cloud Flows, a solution's Workflows tab, or the Home dashboard) |
/cloud-flows/:flowId?environmentId=... | A cloud-only flow: a non-solution flow or a flow shared with you, loaded and saved through the Power Automate API |
/workspace/:flowId | A Flow Workspace flow |
/workspace/new | A new workspace flow, created on first save |
/local/:flowId | A .ff.ts file in your Local Folder |
/flows/new | A new Dataverse flow (the Create Flow button on Cloud Flows) |
Layout
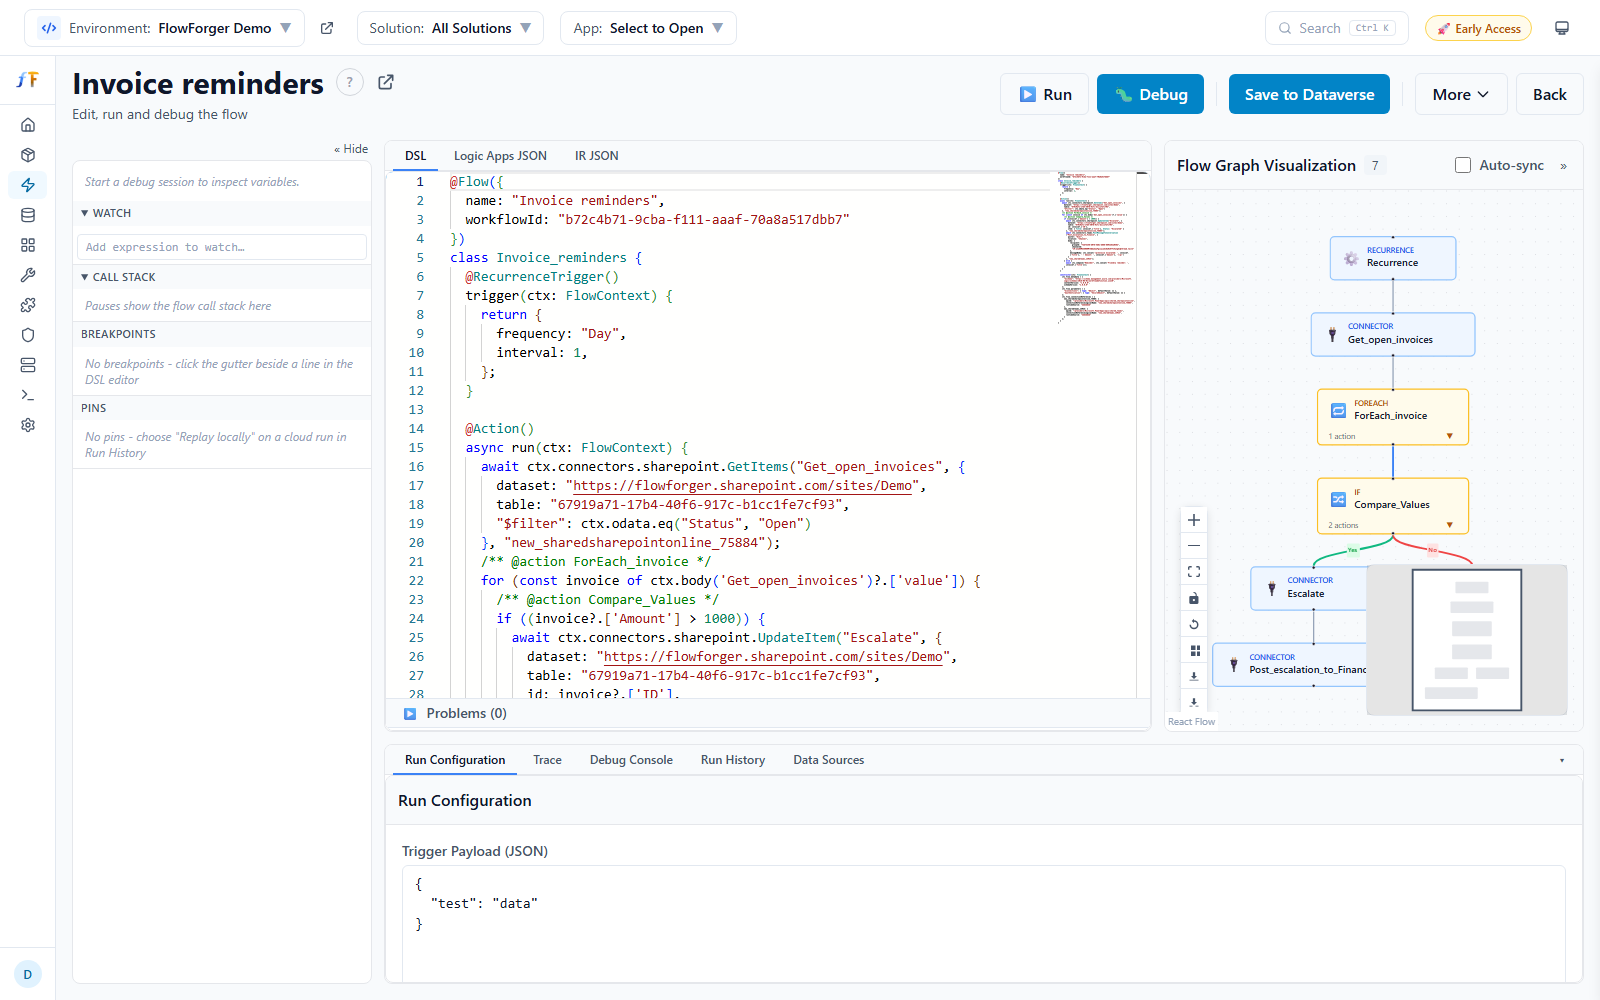 The Flow Editor: header, debug sidebar, center editor tabs, flow graph, and bottom dock.
The editor fills the page beside the navigation sidebar and is made of fixed regions that never rearrange:
- Header -- The flow name, the run and save buttons, and the More menu.
- Debug sidebar (left) -- Variables, Watch, Call Stack, Breakpoints, and Pins.
- Center tabs -- DSL, Logic Apps JSON, and IR JSON.
- Flow graph (right) -- A visual graph of the flow.
- Bottom dock -- The tabs Run Configuration, Trace, Debug Console, Run History (Dataverse and cloud-only flows), and Data Sources.
The sidebar, the graph, and the dock can each be hidden and resized independently:
- Hide the debug sidebar with its collapse button; a Debug » rail stays on the left to bring it back.
- Hide the graph with its close button; a « Graph rail stays on the right.
- Click the active dock tab to collapse the dock to its tab row; click any tab to open it again.
- Drag the borders between regions to resize them.
Sizes and collapsed states are remembered. While a debug session is running, a step toolbar appears above the center tabs; nothing else moves.
Header
On the left:
- The flow name (for a new flow, an Enter flow name... field).
- A ? button that opens the page help panel.
- For Dataverse and cloud-only flows, an icon that opens the flow in the Power Automate maker portal.
- An Unsaved changes badge while the flow has changes that are not saved.
On the right:
| Button | Description |
|---|---|
| ▶ Run | Runs the flow locally to completion, ignoring breakpoints |
| 🐛 Debug | Starts a debug session that pauses before the first action and at enabled breakpoints |
| 📌 N pinned · safe | Shown while pins from a cloud run are loaded; see Replaying a cloud run |
| Primary save button | Save to Dataverse, Save to Power Automate, Save Options (workspace), Save to File (local), or Create Flow for a new flow; see Saving |
| Save Options | Local Folder flows only: the Save Flow dialog with more targets |
| More ▾ | The editor's menu; see More menu |
| Back | Returns to the Flow Workspace (workspace flows) or Cloud Flows |
Editing
The three center tabs show the same flow in three forms. Editing one updates the others about 1.5 seconds after you stop typing; a Converting... banner shows which tab is driving the change, and a dot on that tab marks it as the edit source.
| Tab | Description |
|---|---|
| DSL | The flow as FlowForger TypeScript DSL, with IntelliSense. See the DSL Reference. |
| Logic Apps JSON | The Power Automate definition (clientdata). Editing it regenerates the DSL. |
| IR JSON | The intermediate representation, read-only. See the IR Reference. |
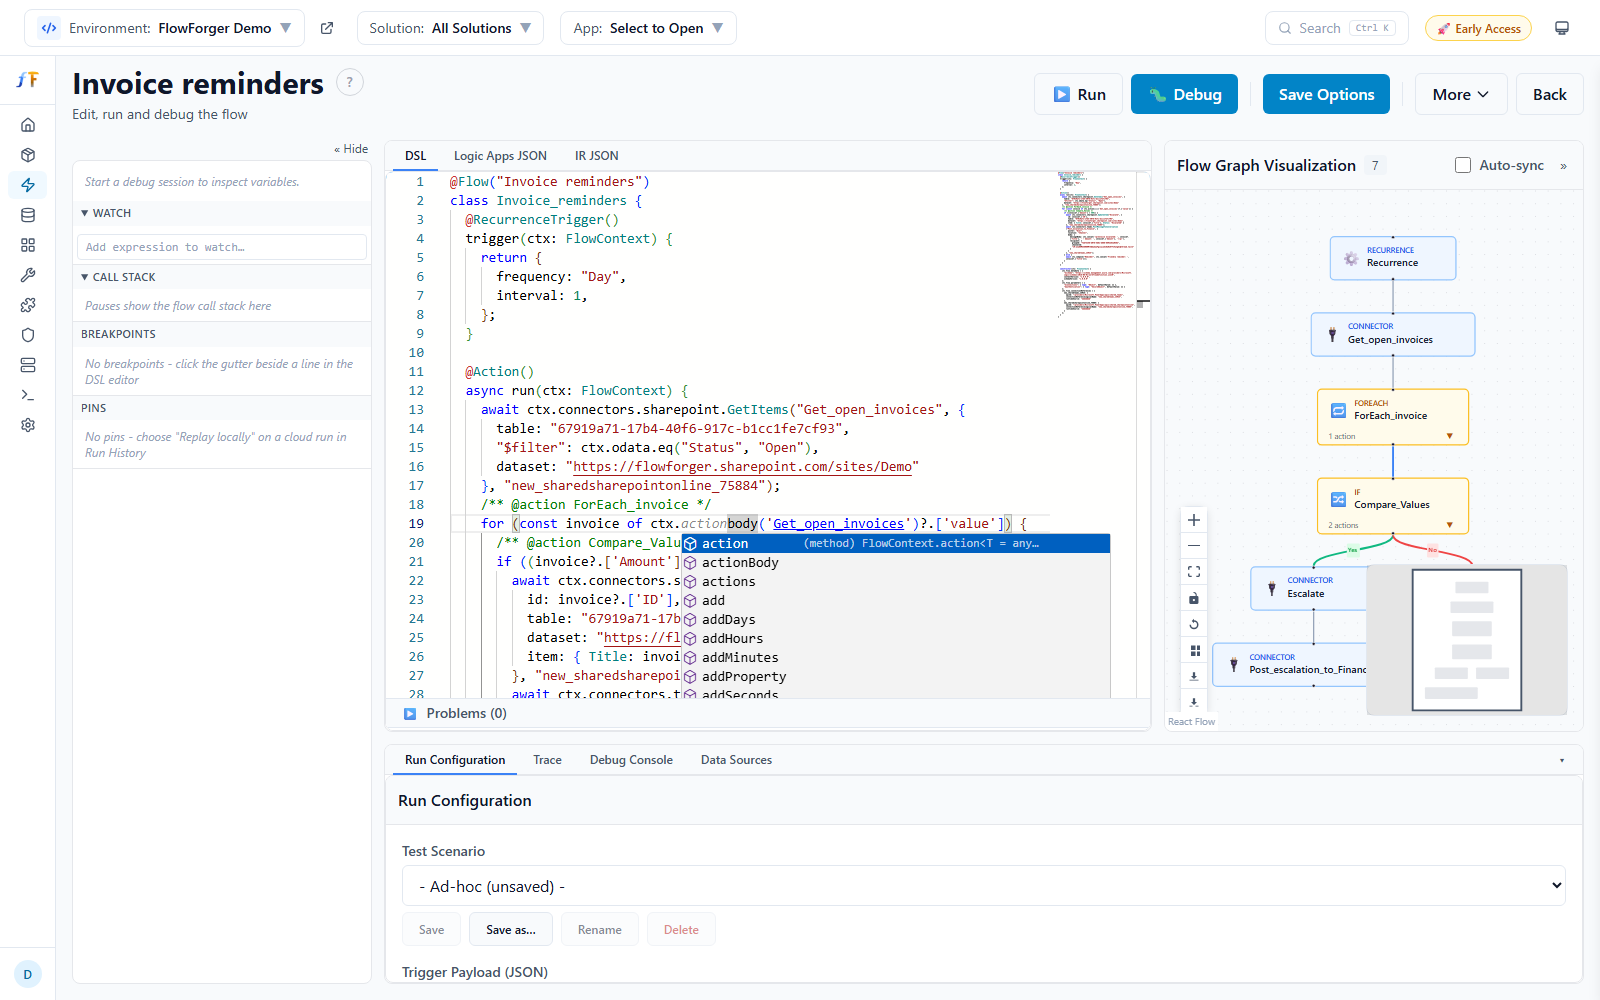 The DSL tab with IntelliSense showing FlowContext methods.
Problems panel
Below the DSL editor, a collapsible Problems panel lists DSL errors and warnings with their line and code. Click a problem to jump to its line. Run and Debug need a flow that compiles. See DSL diagnostics for what each code means. When you save, the definition is also checked against Power Automate's rules, and any problems are listed in a Validation Issues banner above the editor.
Data source autocomplete
Inside ctx.connectors.dataverse.* and ctx.connectors.sharepoint.* calls, the DSL editor completes names from your environment:
- Dataverse table logical names in
entityName: - SharePoint sites in
dataset:and lists intable:(labeled by title; inserting a list inserts its ID) - Column names in
item: { ... }keys and in$select,$orderby, and$filterstrings
Site and list values can come from string literals or from ctx.parameters('X') defaults elsewhere in the file. Completions use sign-ins that already exist and never open a sign-in popup while you type; if metadata cannot be loaded, you simply get no suggestions. Load metadata on the Data Sources tab is the place to sign in.
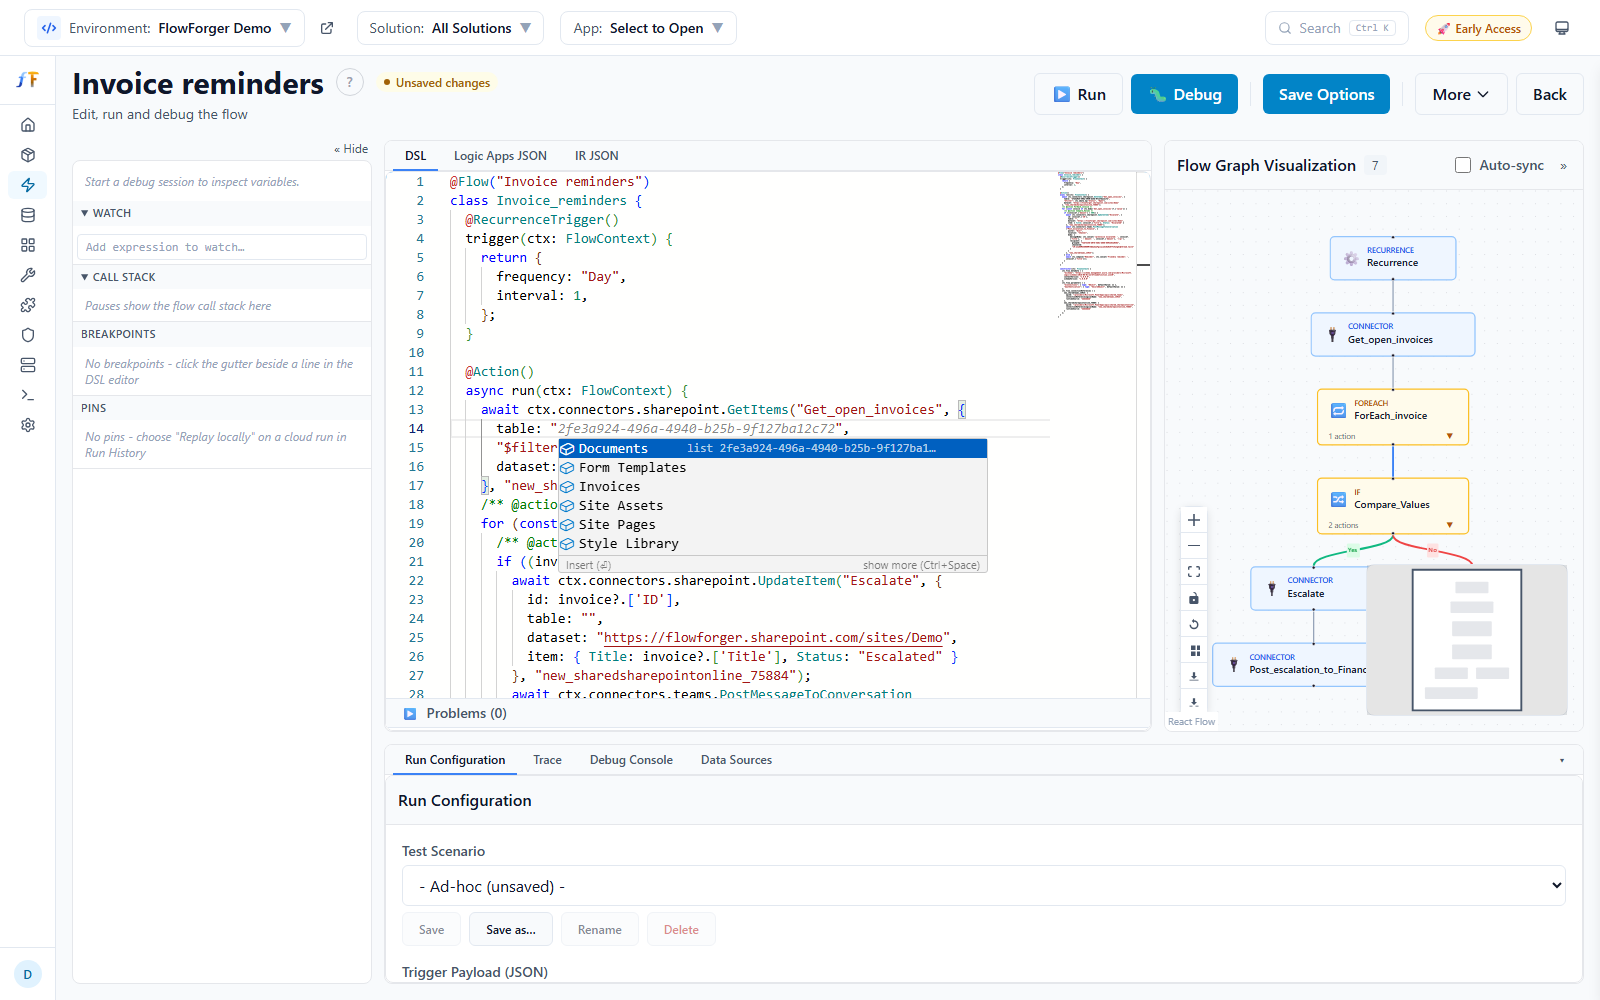 Completing a SharePoint list name in a connector call.
Flow graph
The Flow Graph Visualization pane draws the flow as a diagram. After a run, nodes are colored by their result. The pane offers zoom, fit to view, a reset of the layout, a minimap, and export as PNG or SVG.
- Auto-sync -- When checked, clicking a node scrolls the DSL and IR JSON editors to it, and moving the cursor in the editors highlights the matching node.
- Show in Code -- With Auto-sync off, scrolls the editors to the selected node.
Running a Flow
Click ▶ Run to run the flow in your browser, without deploying it. The run goes straight through and ignores breakpoints. The Trace tab opens as it starts.
Connector actions really run: a SharePoint create or an Outlook send happens for real. Use pins or the CLI's dry-run options (Local testing) when you don't want that.
Run Configuration and test scenarios
The Run Configuration dock tab holds what the run starts with.
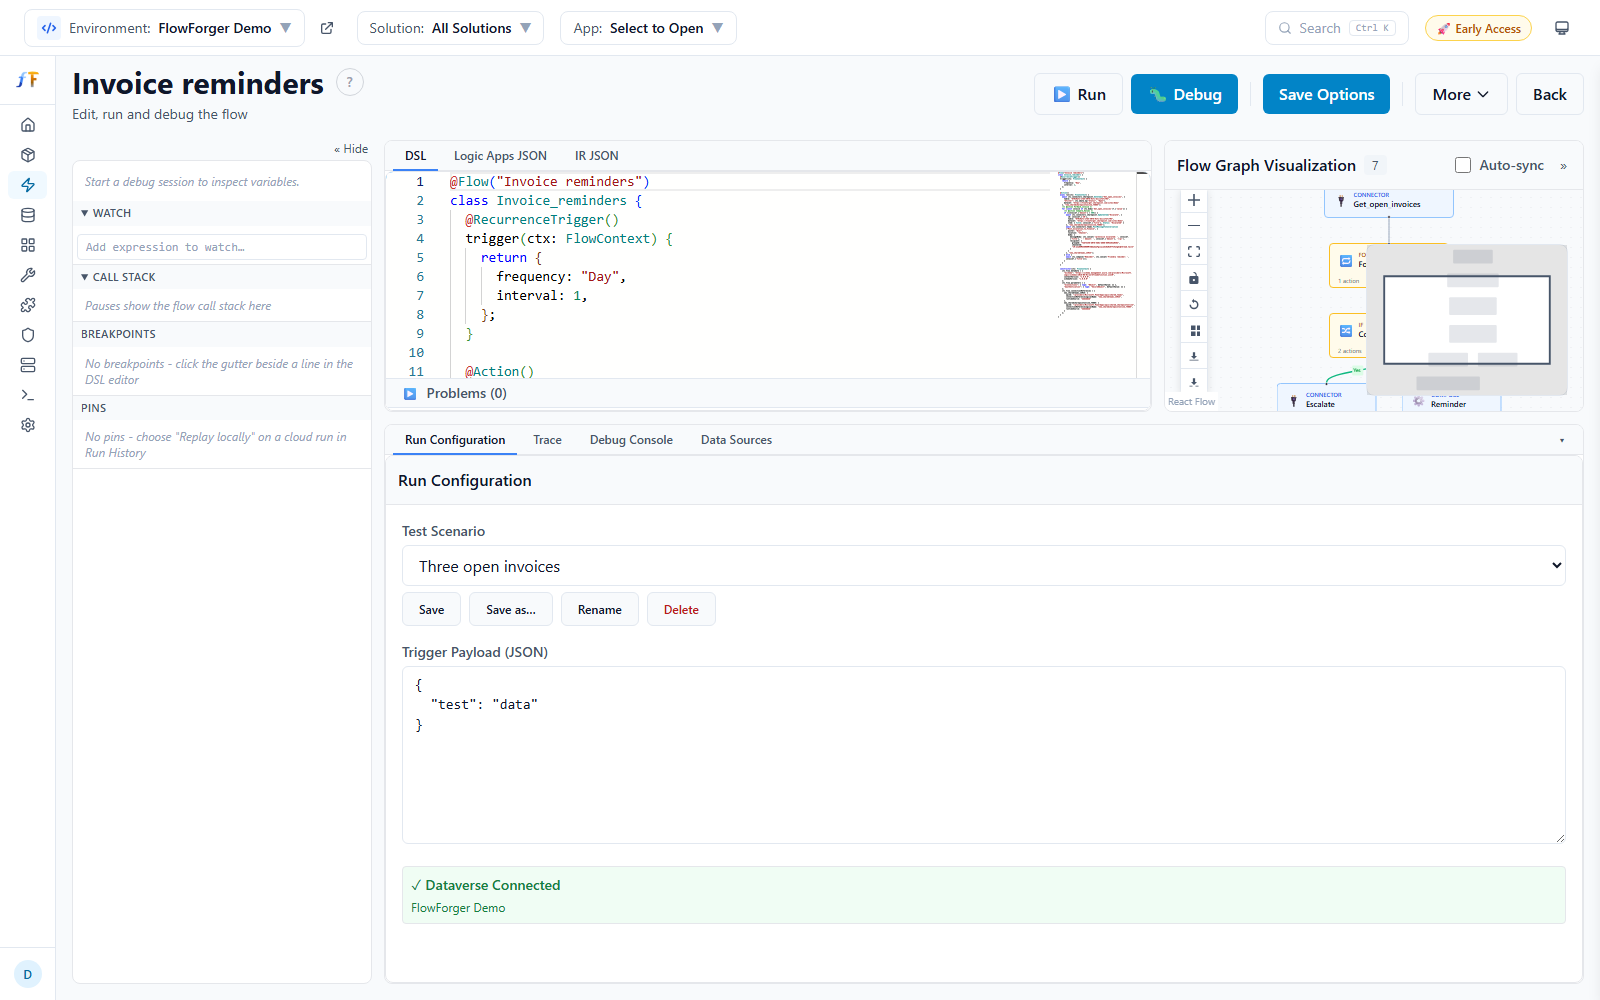 The Run Configuration tab with a saved test scenario selected.
- Trigger Payload (JSON) -- The data the trigger receives (defaults to
{"test": "data"}). Run Locally on a cloud run fills it with that run's trigger data. - Test Scenario (workspace flows only) -- Named, saved run configurations. Choose - Ad-hoc (unsaved) - to work without one, or pick a scenario to load its trigger payload and its pins. Save writes the current payload and pins to the selected scenario, Save as… creates a new one, and Rename and Delete manage it. Scenarios are copied along with an example when you use Copy to my workspace.
- Status badges show what the run can use: ✓ Dataverse Connected (an environment is selected in the header) and ✓ SharePoint Connected (a SharePoint sign-in is available).
Connectors and sign-in
When a run starts, FlowForger looks at the connector actions the flow uses and requests only the permissions they need. The first time, Microsoft may show a consent popup. If a sign-in cannot be obtained, the run continues without that connector, and only the actions that need it fail.
| Connector | Runs against |
|---|---|
| HTTP | Any URL; no sign-in needed |
| Dataverse | The environment selected in the header |
| SharePoint | The site found in the flow's SharePoint actions (a literal, a parameter default, or a variable's initial value). If no site can be determined before the run, no SharePoint sign-in is requested and SharePoint actions fail with a message saying so. |
| Microsoft 365 (Outlook, Teams, Word Online, Excel Online, OneDrive, Office 365 Users, Office 365 Groups) | Microsoft Graph, with your account |
| Approvals | Not run locally: there is no local Approvals connector, and waiting for an approval (ctx.connectorWebhook()) is simulated as a success |
Flow parameters that are backed by environment variables use their current values in the selected environment (the value, otherwise the definition's current default), not the default stored in the flow. The Data Sources tab shows which values a run uses.
Trace tab
The Trace tab shows the result of the last run or the progress of the current debug session.
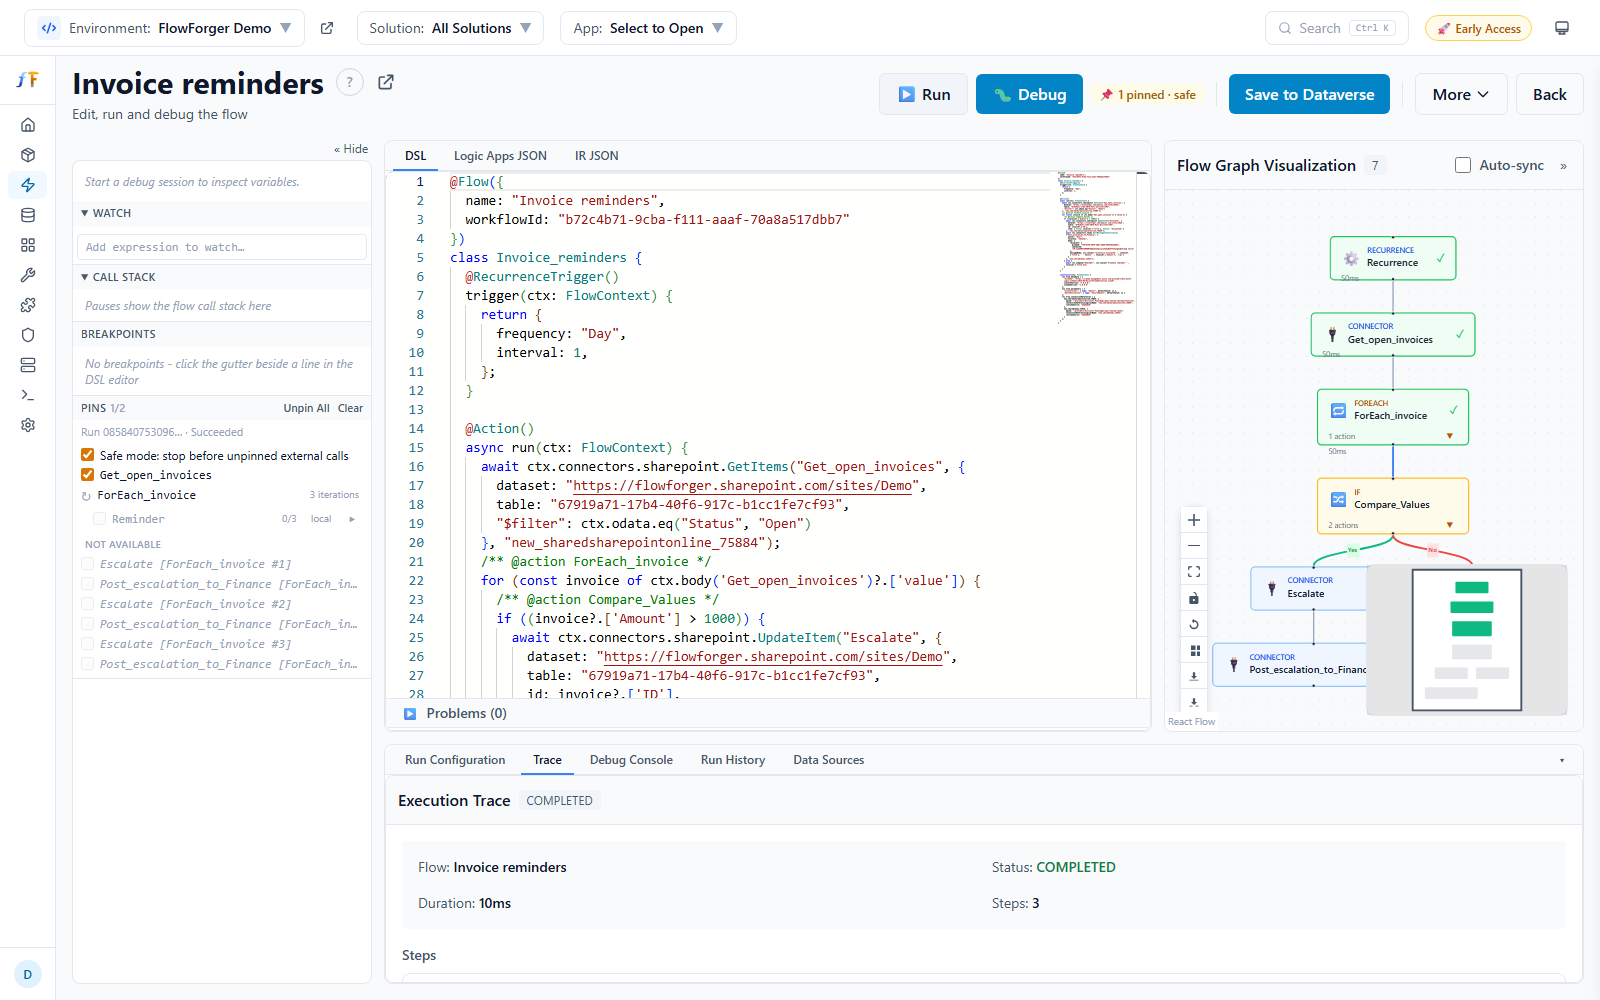 A loop in the trace with the iteration filter, failed-only filter, Break here buttons, and PINNED badges.
- A summary with the flow name, Status (COMPLETED, FAILED, or RUNNING), duration, and step count.
- One collapsible row per action with a status icon, its name, type, and duration. Expand it for Inputs (connector, HTTP, and child-flow calls), Outputs, and Error. Failed actions show their error.
- Badges: CURRENT (where a debug session is paused), PINNED (the action did not run; its outputs come from a pin), and CHILD FLOW (a call to a child flow, with the child's own steps nested inside).
- A ● button on each row toggles a breakpoint on that action.
- Files that actions produced can be downloaded from their row and from the Files section.
- A Variables section with the final variable values.
Loops show an Iterations (N) section (Loop Iterations for Do-Until loops), each iteration expandable with its current item and its actions. For loops with many iterations:
- Find iteration… searches each iteration's label, item, and its actions' outputs and errors.
- failed only shows only iterations with a failed action.
- Iterations are shown in pages of 50; failed iterations and the current one are always shown.
- ⏺ Break here sets a breakpoint on the loop body's first action that fires only in that iteration (see Iteration breakpoints). It is offered in the main flow's trace, not in a child flow's.
Debugging
Click 🐛 Debug (or press F5) to start a debug session. The session pauses before the first action, and again at every enabled breakpoint. The Debug Console tab opens as it starts.
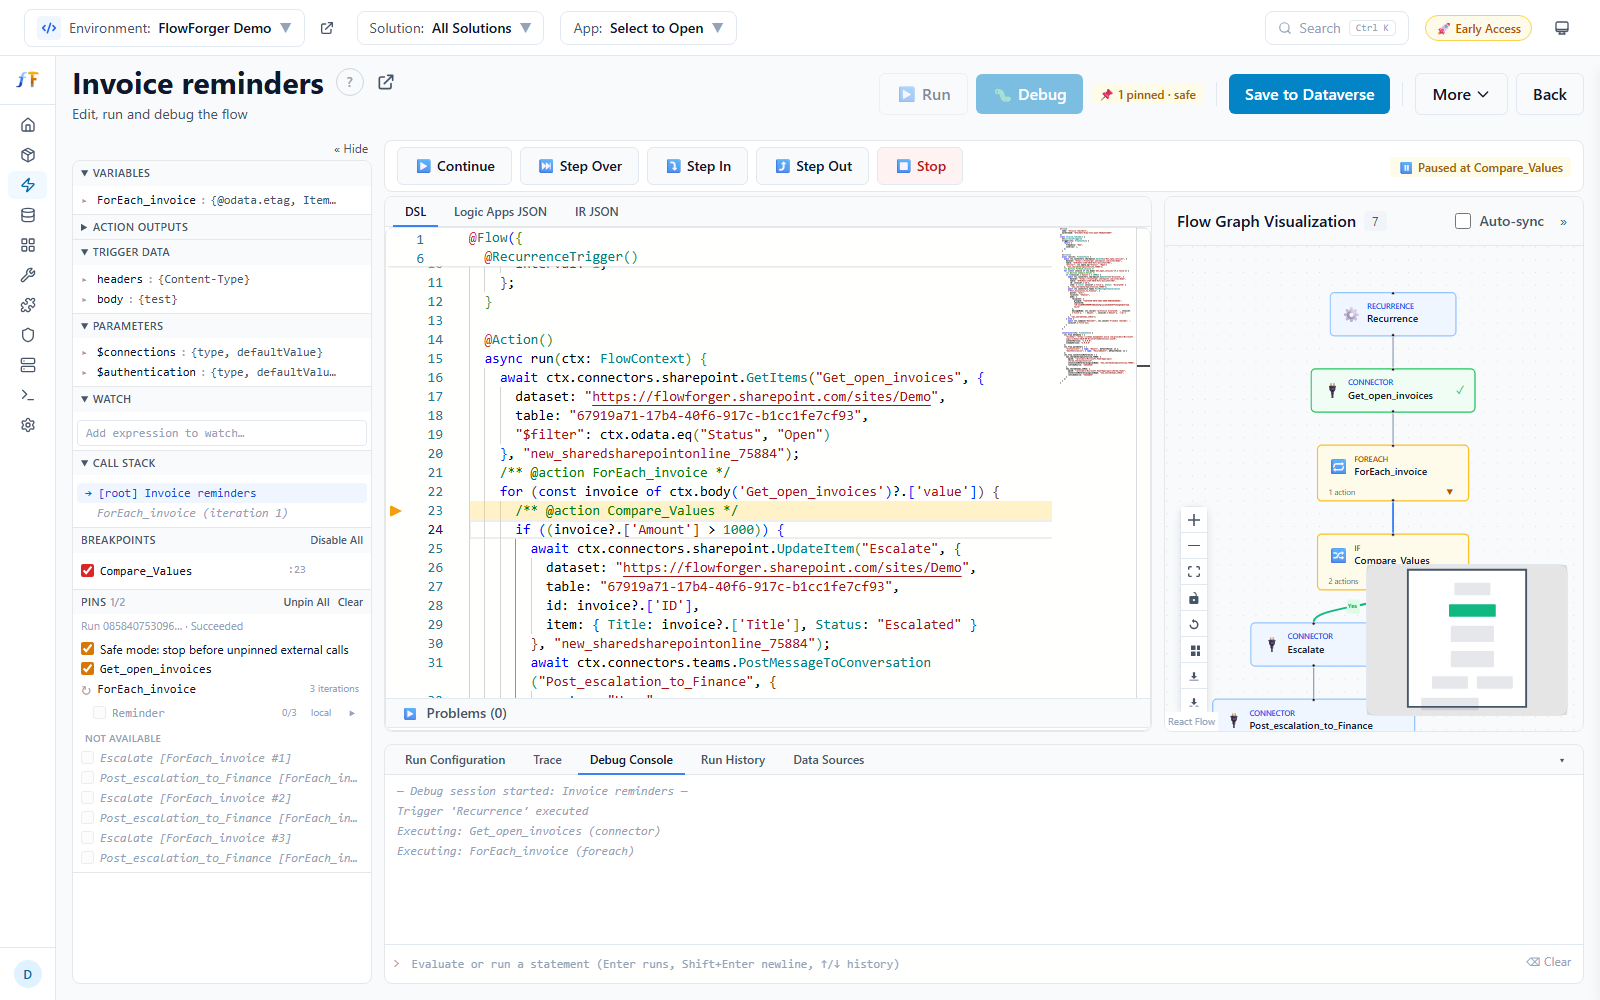 Paused inside a foreach, with an action's inputs in Action Outputs and the Breakpoints pane showing a disabled, a conditional, and an iteration breakpoint.
Step toolbar
While a session runs, a toolbar appears above the center tabs:
| Button | Key | Description |
|---|---|---|
| ⟳ Apply changes & continue | Ctrl+Shift+F5 | Shown when you edited the DSL while paused; see Edit & Continue |
| ▶ Continue | F5 | Runs to the next breakpoint or the end |
| ⏭ Step Over | F10 | Runs the current action and pauses at the next one |
| ⤵ Step In | F11 | Steps into a child flow call |
| ⤴ Step Out | Shift+F11 | Runs to the end of the current child flow |
| ⏹ Stop | Shift+F5 | Ends the session |
A status chip on the right shows whether the session is running or paused. The DSL editor highlights the current line, and hovering over a variable or action name in the DSL shows its current value.
Variables
The top of the debug sidebar shows the paused state in four scopes:
- Variables -- The flow's variables.
- Action Outputs -- Every action that has run, with its
status,outputs, anderror. Connector, HTTP, and child-flow actions also haveinputs: the payload they were actually sent with, after expressions were evaluated. Inputs are kept for failed calls too, so you can see what was sent. - Trigger Data -- The trigger's outputs.
- Parameters -- The flow's parameters.
Expand values to drill into them. The ⧉ button on a row copies its value (the whole row or a nested field). Some rows can be revealed in the editor.
Watch
The Watch pane keeps expressions that are re-evaluated at every pause and when the run ends. Type in Add expression to watch… and press Enter. A watch can be a DSL expression, a Power Automate expression starting with @, or a bare variable or action name. Double-click a watch to edit it, or remove it with its remove button. In the DSL editor, right-click and choose Add to Watch to watch the selection, or the name under the cursor. Watch expressions are remembered per flow.
Call Stack
The Call Stack pane lists the flow and any child flows the session has stepped into. Click a frame to inspect its variables and evaluate watches in it.
When you step into a child flow, the DSL tab shows the child's generated source, read-only, with its own breakpoints. Click ← Back to parent to show the parent flow again.
Debug Console
The Debug Console dock tab evaluates input against the paused session, and also after the run has ended. You can enter:
- A DSL expression, for example
item.Status === 'Rejected' - A Power Automate expression starting with
@, for example@length(body('Get_items')?['value']) - A bare variable or action name
- A statement, such as an assignment or a connector call. Statements run against the live session, so a connector call really calls out.
Press Enter to run, Shift+Enter for a new line, and ↑/↓ for history. The console also logs session events (started, completed, failed, rewinds). The clear button empties it.
Breakpoints
Set a breakpoint by clicking the gutter beside a DSL line, by pressing F9 at the cursor (on a line without an action it moves to the next line that has one), with the ● on a trace row, or on a node in the flow graph.
The Breakpoints pane lists every breakpoint, grouped per flow once child flows are involved:
- The checkbox enables or disables a breakpoint. A disabled breakpoint stays listed and stays in the gutter (as a hollow dot) but does not pause the run. Disable All / Enable All in the pane header switch all of them.
- Click a row to show its line in the editor. The line number is shown on the right.
- ✎ adds or edits a condition; ✕ removes the breakpoint.
- A breakpoint whose action no longer exists is shown grayed out and cannot bind.
Breakpoints are not saved with the flow and are cleared when you reload the page.
Conditional breakpoints
A condition makes a breakpoint pause only when a DSL expression is true, for example item.Status === 'Rejected'.
- Click ✎ on the row, or right-click the line in the DSL editor and choose Edit Breakpoint Condition….
- Type the condition and press Enter to save, or Escape to cancel. An empty condition removes it.
- A breakpoint with a condition shows an ƒ chip in the pane and a marked dot in the gutter.
The breakpoint pauses only when the condition evaluates to exactly true. If it cannot be evaluated, or evaluates to something that is not true or false (for example a mistyped field that gives null), the breakpoint pauses anyway and the Debug Console explains why, so a typo never silently disables it.
Iteration breakpoints
⏺ Break here on a loop iteration in the trace, or ⏺ on an iteration in the Pins pane, sets a breakpoint that fires only in that iteration. The Breakpoints pane shows it with a chip such as #3 (iterations are numbered from 1). Click the chip's ✕ to make it pause in every iteration again.
The breakpoint goes on the first action of the loop body. If the body starts with a condition, switch, or nested loop, the breakpoint goes on that block itself, so it fires whichever branch the iteration takes.
Edit & Continue
While paused, you can change the DSL and continue without starting over:
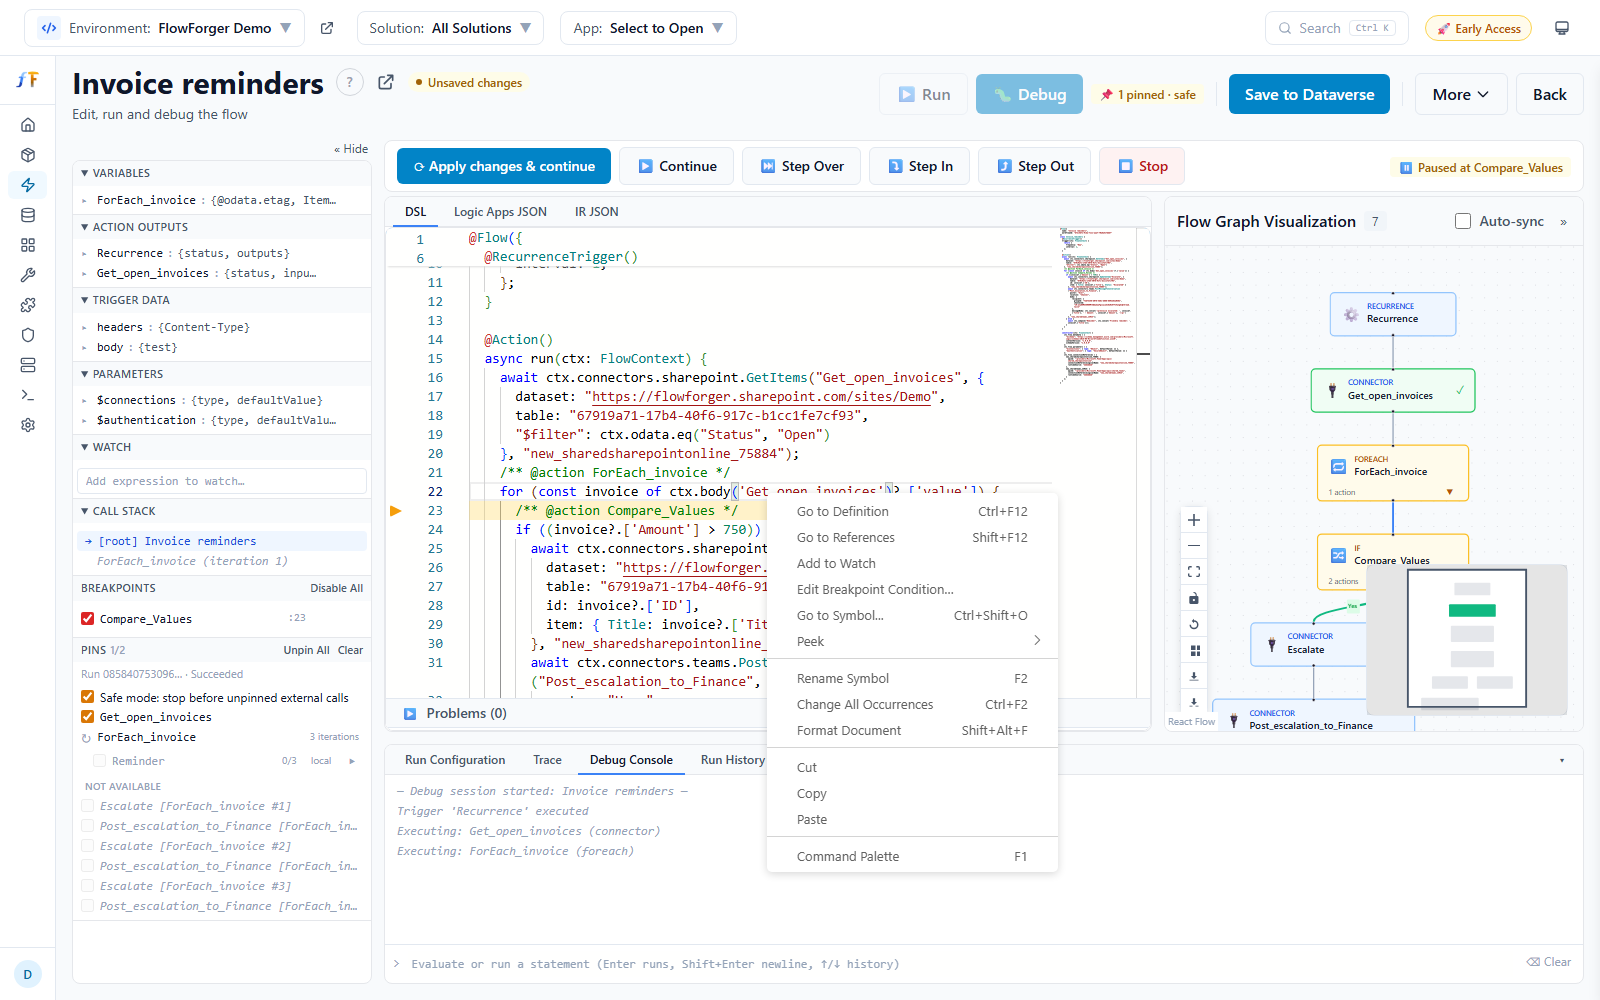 The Apply changes & continue button, and the DSL editor's context menu with Jump to This Line and Edit Breakpoint Condition….
- Edit the DSL.
- Click ⟳ Apply changes & continue (or press Ctrl+Shift+F5).
The flow restarts in the background. Connector and HTTP calls that already ran are replayed from what was recorded, not sent again; a call whose inputs your edit changed runs live. The session fast-forwards to where you were paused, or to the first place where the run now differs, and pauses there. Inputs that contain utcNow(), guid(), rand(), or ticks() are ignored when matching recorded calls, so they don't count as a difference. If the edited DSL does not compile, the error is shown and the session stays paused where it was.
Set Next Statement
While paused, right-click a line in the DSL editor and choose Jump to This Line (Set Next Statement), or press Ctrl+Shift+F10 with the cursor on it. The session pauses before that statement without running anything in between:
- Jumping forward skips the statements in between.
- Jumping backward runs those statements again, live, with the current variables and outputs.
- On a line without a statement, the jump goes to the next statement below.
The jump is not available while the DSL has edits you have not applied (apply them first), or while a child flow's source is shown. When you are paused inside a condition, switch, scope, or loop iteration, a backward jump restarts the run instead: recorded calls replay up to the target, and the target and everything after it run live. Variable changes you made in the console are not kept, and the console notes the restart.
Replaying a Cloud Run
A replay runs the flow locally with the inputs and connector results of a run that already happened in the cloud. It is the way to reproduce a production failure without sending anything again.
Start a replay with Replay locally on a run in the Flow Run History page, or with Replay in the editor's Run History tab. The editor then:
- downloads the run's recorded outputs, showing ⏳ Loading cloud run… N/M in the header (Run and Debug are disabled until it finishes),
- puts the run's trigger outputs in the trigger payload,
- pins every connector, HTTP, and child-flow action to the outputs the cloud recorded, per loop iteration, and a failed action as a failure with its error,
- turns safe mode on, and shows 📌 N pinned · safe in the header.
Compose actions, variables, and conditions are not pinned: they recompute, so a change you make to them shows up in the replay. A pinned action does not run; its trace row carries a PINNED badge.
For a command-line replay of the same kind, see Cloud runs.
Pins pane
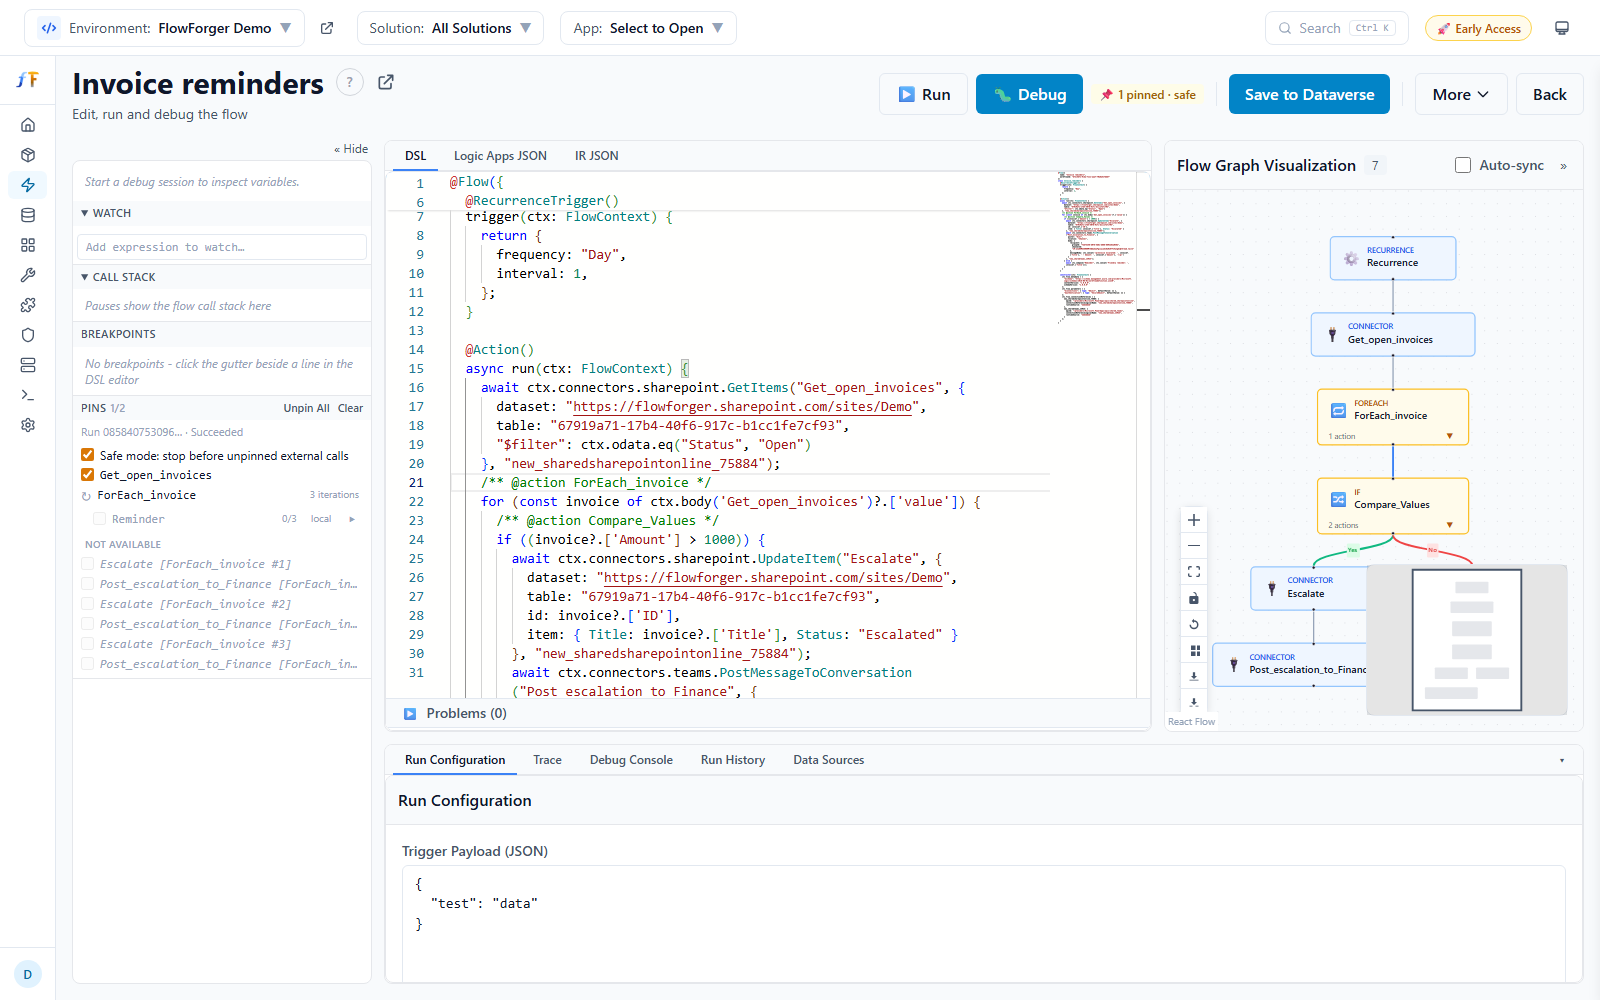 The Pins pane after replaying a run with a loop.
The Pins pane in the debug sidebar shows what is pinned:
- The header shows how many actions are pinned out of those that can be (an action in a loop counts once), Pin All / Unpin All, and Clear (removes every pin).
- Below it, the run the pins come from (Run … with its status, or From scenario), and the Safe mode: stop before unpinned external calls checkbox.
- One row per action with a checkbox: checked replays the recorded result, unchecked runs the action live. Click the name to show the action in the DSL. Chips mark actions that failed in the cloud run and local actions (not connector, HTTP, or child-flow calls).
- Loops show N iterations and k failed. Under a loop, each action has a three-state checkbox for all its iterations and a
pinned/totalcount; expand it for one row per iteration, with ⏺ to break at that iteration. Iterations are labeled by number, and by the item's title once a local run has shown it (for example#217 · Invoice 4711). Loops with more than 10 iterations have a Find iteration… box that searches the iteration labels and the recorded outputs and errors.
To keep the replay fast, outputs of local actions are not downloaded up front. Checking such an action downloads its recorded outputs then. Pin All pins only actions whose outputs are already loaded.
Actions that cannot be pinned are listed separately:
- Not available -- skipped in the cloud run, secure outputs that cannot be downloaded, or no outputs recorded.
- Not downloaded -- pins restored from a test scenario whose outputs were never downloaded. Replay the cloud run again to pin them.
- Not in this flow -- recorded by the cloud run, but the flow no longer has an action (or loop) with that name.
Changes you make in the pane apply to the next action, even while paused. In a workspace flow, Save or Save as… in Run Configuration stores the pins with the test scenario. For Dataverse and cloud-only flows, pins last for the browser session.
Safe mode
With safe mode on, a connector, HTTP, or child-flow action that has no pin is never sent by accident:
- A Run stops before it. The error banner names the action and shows the inputs it would have sent; nothing after it runs.
- A Debug session pauses before it. The top of the debug sidebar shows Safe mode - would call out, the action, and its inputs, with three choices: ▶ Run live (send it and continue), 📌 Run live & pin (send it, then pin its result so the next replay does not send it again), and ⏹ Stop.
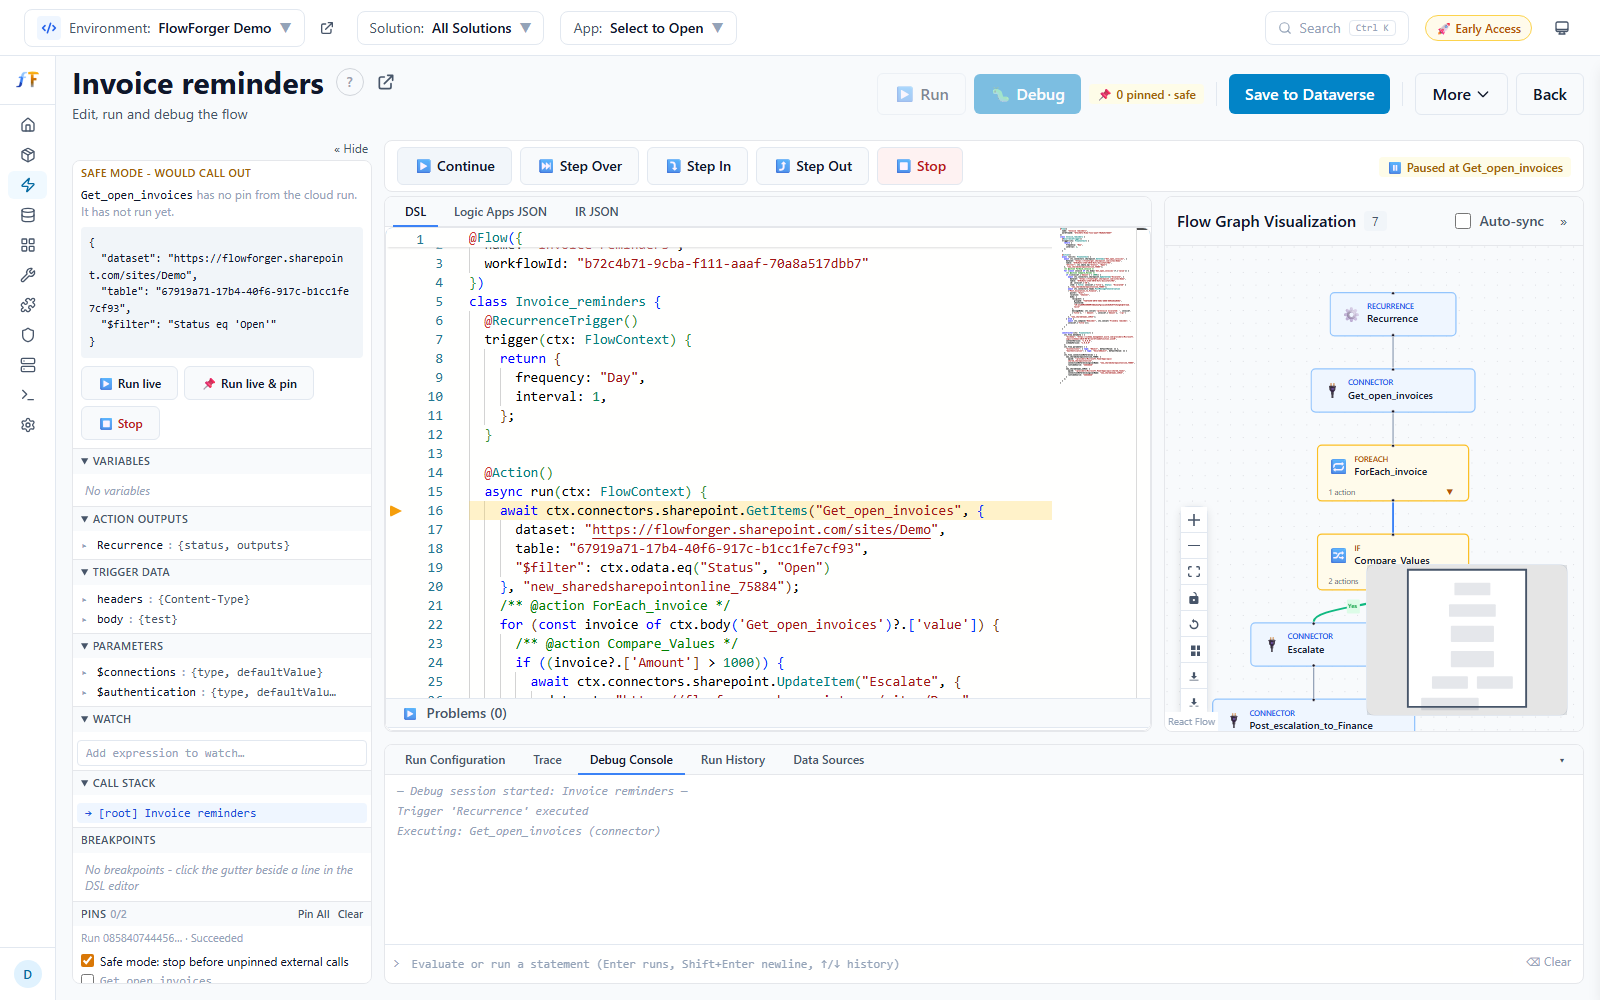 A debug session paused by safe mode before an unpinned call.
Unchecking an action's pin is not enough to let it run in a plain run while safe mode is on: turn safe mode off, or debug the flow and choose Run live.
Data Sources Tab
The Data Sources dock tab lists every external data source the flow touches, found in its trigger and actions.
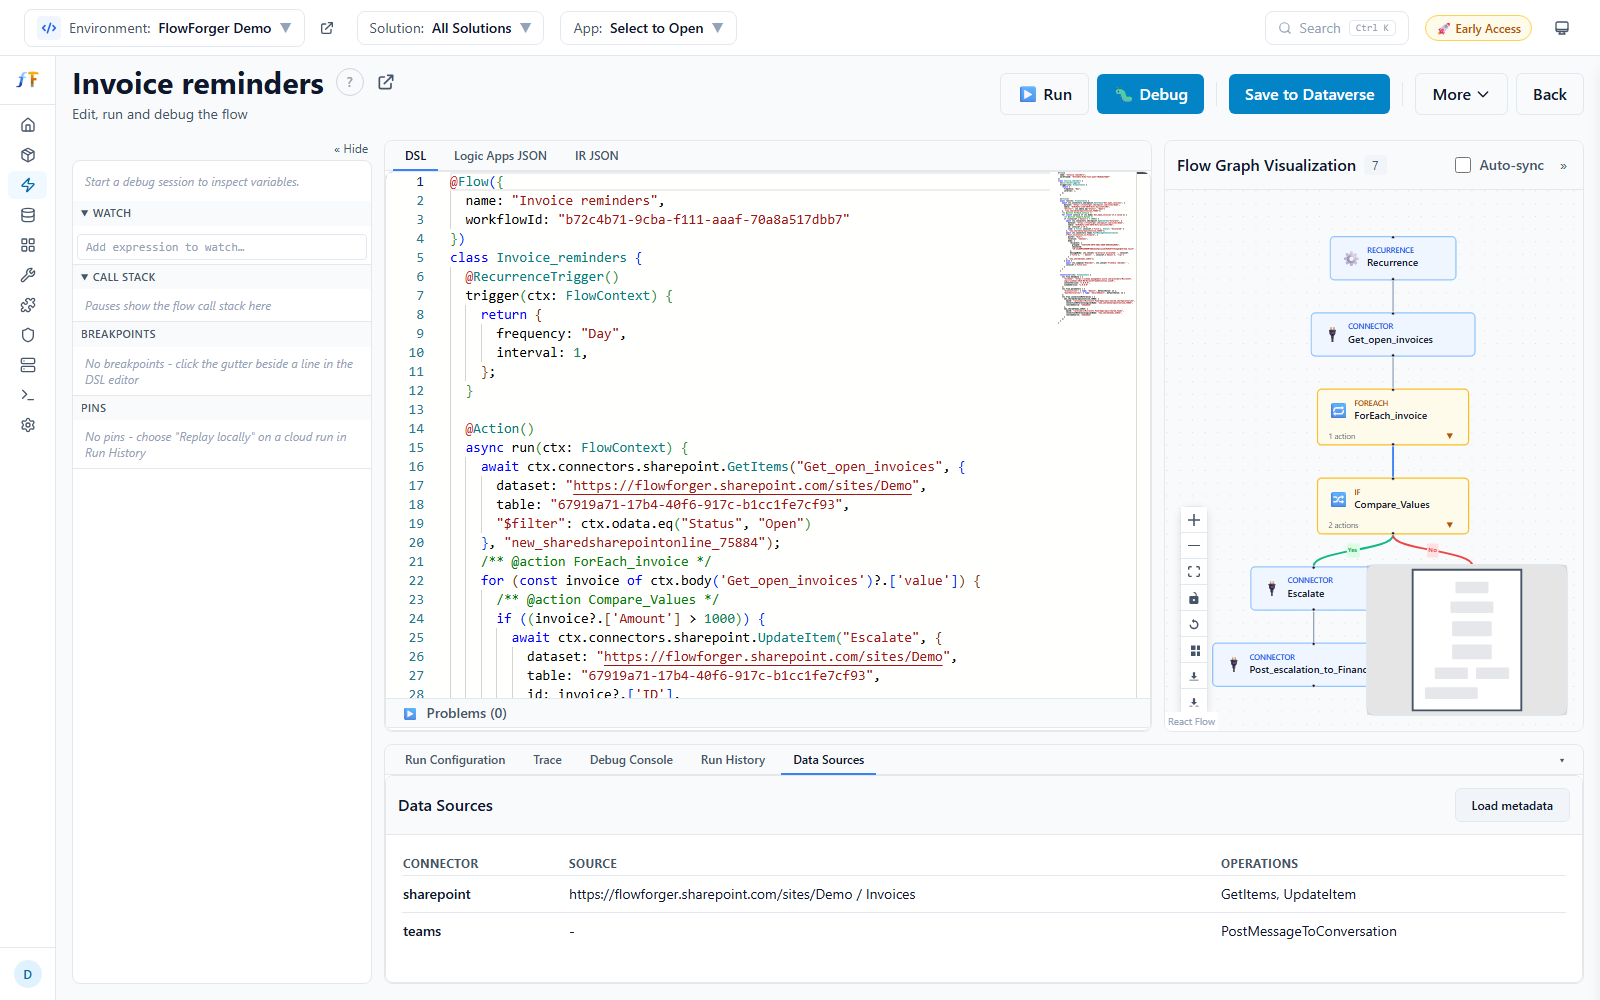 The Data Sources tab after Load metadata, with the environment variables table.
- The table has Connector, Source (Dataverse table, or SharePoint site and list), and Operations columns. Under a source, a note says where its value comes from: via parameter X, via variable Y, or dynamic: with the expression when it is only known at run time.
- Load metadata resolves display names (table names, list titles). It is the one place in the editor that may ask you to sign in or consent. Until then a source shows metadata not loaded; if loading fails, metadata unavailable and the raw names.
- Environment variables lists every parameter backed by an environment variable: Parameter, Schema name, Current value (the value in the selected environment, marked set value or definition default; not found when there is none and runs use the flow default), Flow default, and Feeds (how many data sources use it). Current values load with Load metadata or when you run the flow.
Run History Tab
Dataverse and cloud-only flows have a Run History dock tab with the flow's recent cloud runs: Started, Duration, Status, Trigger, and Error, filter buttons (All, OK, Errors, Running), a record limit (25 to 250), and a refresh button. Each run has:
- Run Locally -- Puts the run's trigger data in Run Configuration.
- Replay -- Loads the run as pins; see Replaying a cloud run.
- Details -- Opens the Run Details panel.
- Portal -- Opens the run in the Power Automate portal.
A link opens the full Flow Run History page.
Saving
The primary save button depends on where the flow comes from. Before any save, the definition is checked: errors block the save, and warnings ask whether to continue.
Dataverse flows
Save to Dataverse asks for confirmation and then updates the flow definition in the environment.
The first time you save, a Backup Flow Before Saving? dialog asks whether FlowForger should keep a backup copy of the current definition before each save (Yes, enable backups / No, skip backups). You can change this later in Settings (Data & Backup).
A Dataverse flow has two descriptions: the one in the definition, shown as the comment at the top of the DSL, and the description on the flow's details page in the maker portal. When you save, the details-page description is updated too if it had the same text as the DSL comment when you opened the flow. A description set separately in the portal is never overwritten.
For a new flow (/flows/new), enter a name and click Create Flow. The flow is created as a draft, in the solution selected in the header if there is one.
Cloud-only flows
Save to Power Automate asks for confirmation and updates the flow through the Power Automate API. No backup is made. The flow's connection references are saved exactly as they were loaded, because rewriting them would detach the flow's connections:
- If the definition refers to a connection the flow does not have, the save is refused with the names of the missing connections; change them back to the original names.
- Edits to the connection references in the Logic Apps JSON tab are ignored, with a warning.
- Connection Refs in the More menu is disabled for these flows.
Workspace flows
Save Options opens the Save Flow dialog:
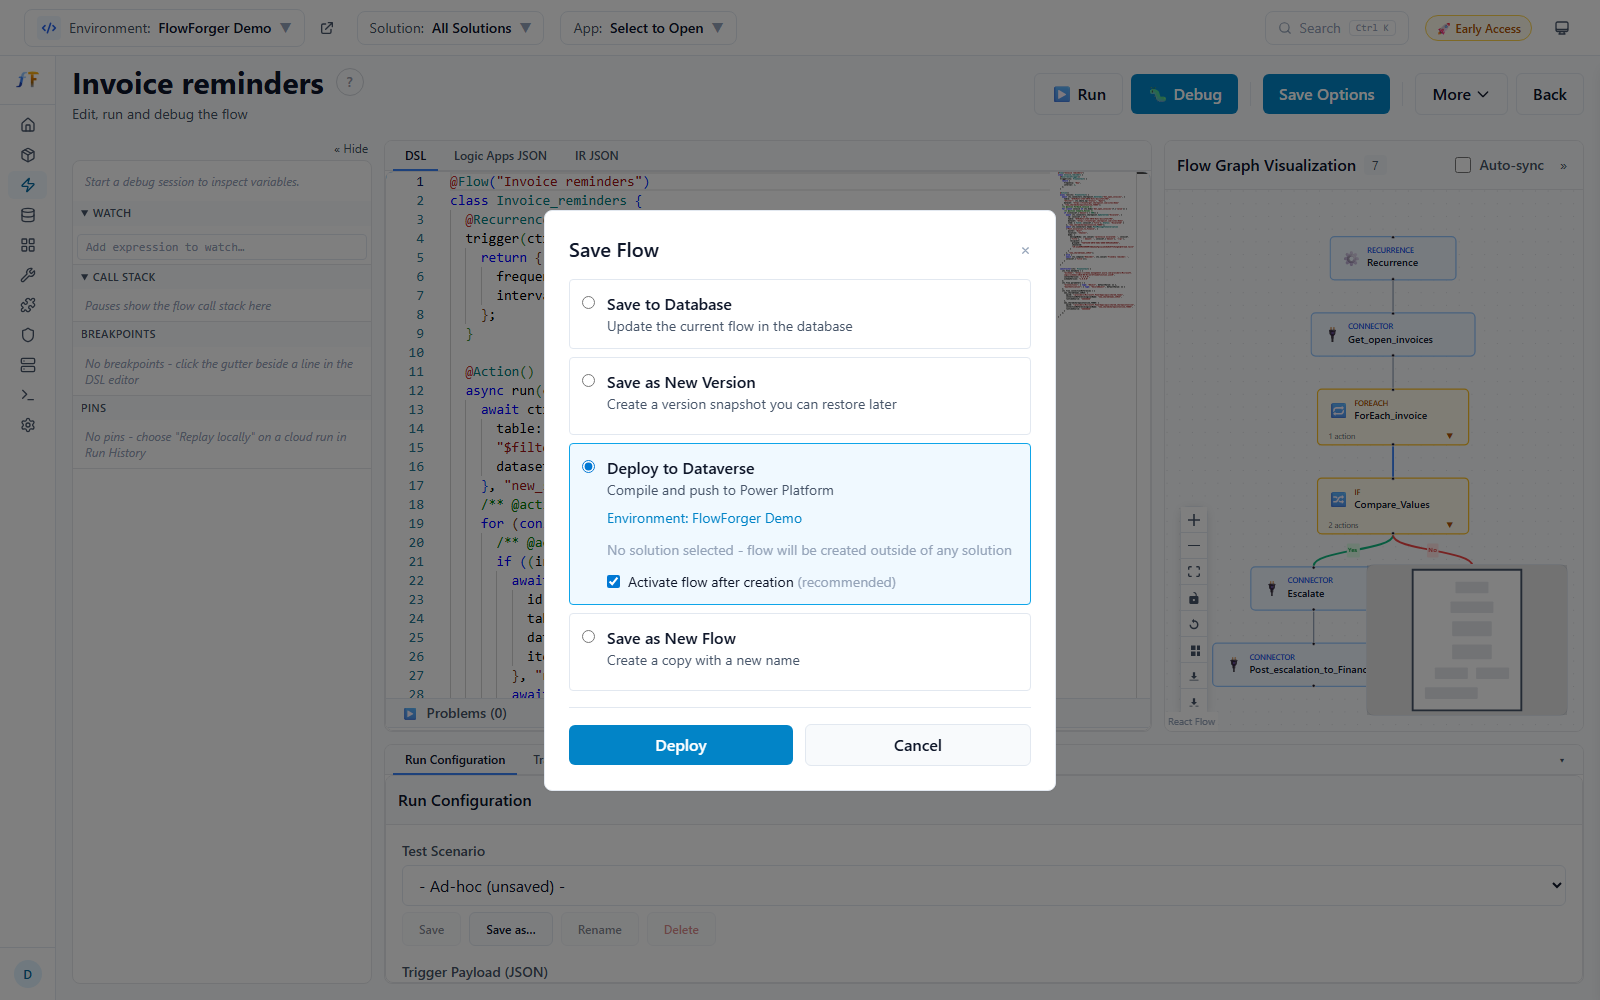 The Save Flow dialog with its save targets.
| Option | Description |
|---|---|
| Save to Database | Updates the current flow in the workspace |
| Save as New Version | Saves the flow and creates a version snapshot, with an optional label and description |
| Deploy to Dataverse | Compiles and pushes the flow to the environment selected in the header |
| Save as New Flow | Creates a copy with a new name in the workspace |
A new workspace flow (from + New Flow) offers Deploy to Dataverse and Save as New Flow; the flow is stored when you save it.
Deploy to Dataverse shows the environment and solution from the header. When a solution is selected, you choose between Update existing flow (a list of the solution's flows; one with a matching name is selected for you) and Create new flow in Dataverse. Without a solution, the flow is created outside any solution. When creating, Activate flow after creation is checked by default. The button reads Deploy or Update Flow. During deployment:
- Missing connection references are listed; Create N References & Continue creates them.
- Missing environment variables are listed with their types and default values; Create N Variables & Deploy creates them.
- The flow is created or updated, activated if you chose that, and recorded in the flow's deployment history. A new flow opens in the Power Automate maker portal.
Local Folder flows
Save to File writes the DSL back to the .ff.ts file. Save Options opens the Save Flow dialog with Save to File, Deploy to Dataverse, and Save as New Flow.
Unsaved changes
While the flow has unsaved changes (or a run is in progress), the header shows Unsaved changes, the browser asks before you close or reload the page, and switching environments in the header asks for confirmation.
More Menu
The More ▾ button in the header holds the rest of the editor's commands, in groups:
| Item | Available for | Description |
|---|---|---|
| Download | Saved flows | Downloads the Logic Apps JSON as a .json file |
| Export | Saved flows | Downloads a ZIP with logicapps.json, dsl.ff.ts, and ir.json |
| Save As New | Dataverse flows | Creates a copy under a new name, as a draft, in the solution selected in the header |
| Save Version | Workspace flows | Creates a version snapshot (asks for an optional label and message) |
| History | Workspace flows | Opens Version History |
| Source | Workspace flows | Opens Source & Deployment Tracking |
| Flow Details | Saved flows | Metadata: status, created, modified, owner, source, and ID, where available |
| Configure Trigger | All | Changes the trigger: Manual, HTTP, Recurrence, or Connector, with its properties (HTTP method and path, frequency, interval, time zone, start time, and schedule) |
| Connection Refs | All except cloud-only flows | Lists the connection references the flow uses, with Replace and Delete, and adds new ones from the environment |
| Env Variables | All | Lists the environment variables the flow uses with their type, current value, and data source URL, with Replace and Delete |
| Validate | All (needs an environment) | Checks connection references and environment variables against the environment; see below |
| Optimize | All | Suggests improvements to the DSL; see below |
| Compare with... | Saved flows | Pins the flow for comparison; see Compare Tools |
| Trigger URL | Dataverse and cloud-only flows | Shows the HTTP trigger URL |
| Activate / Deactivate | Dataverse flows | Turns the flow on or off (with confirmation) |
| Turn On / Turn Off | Cloud-only flows | Turns the flow on or off through the Power Automate API |
Validation
Validate checks the flow against the selected environment:
- Fetches the environment's connection references and environment variable definitions.
- Finds the connection references and environment variables the flow needs.
- Identifies missing connection references, with existing ones of the same connector suggested for reuse.
- Identifies missing environment variables.
- Opens the Validation Dialog, where you choose to reuse existing items or create new ones, and apply the choices to the DSL.
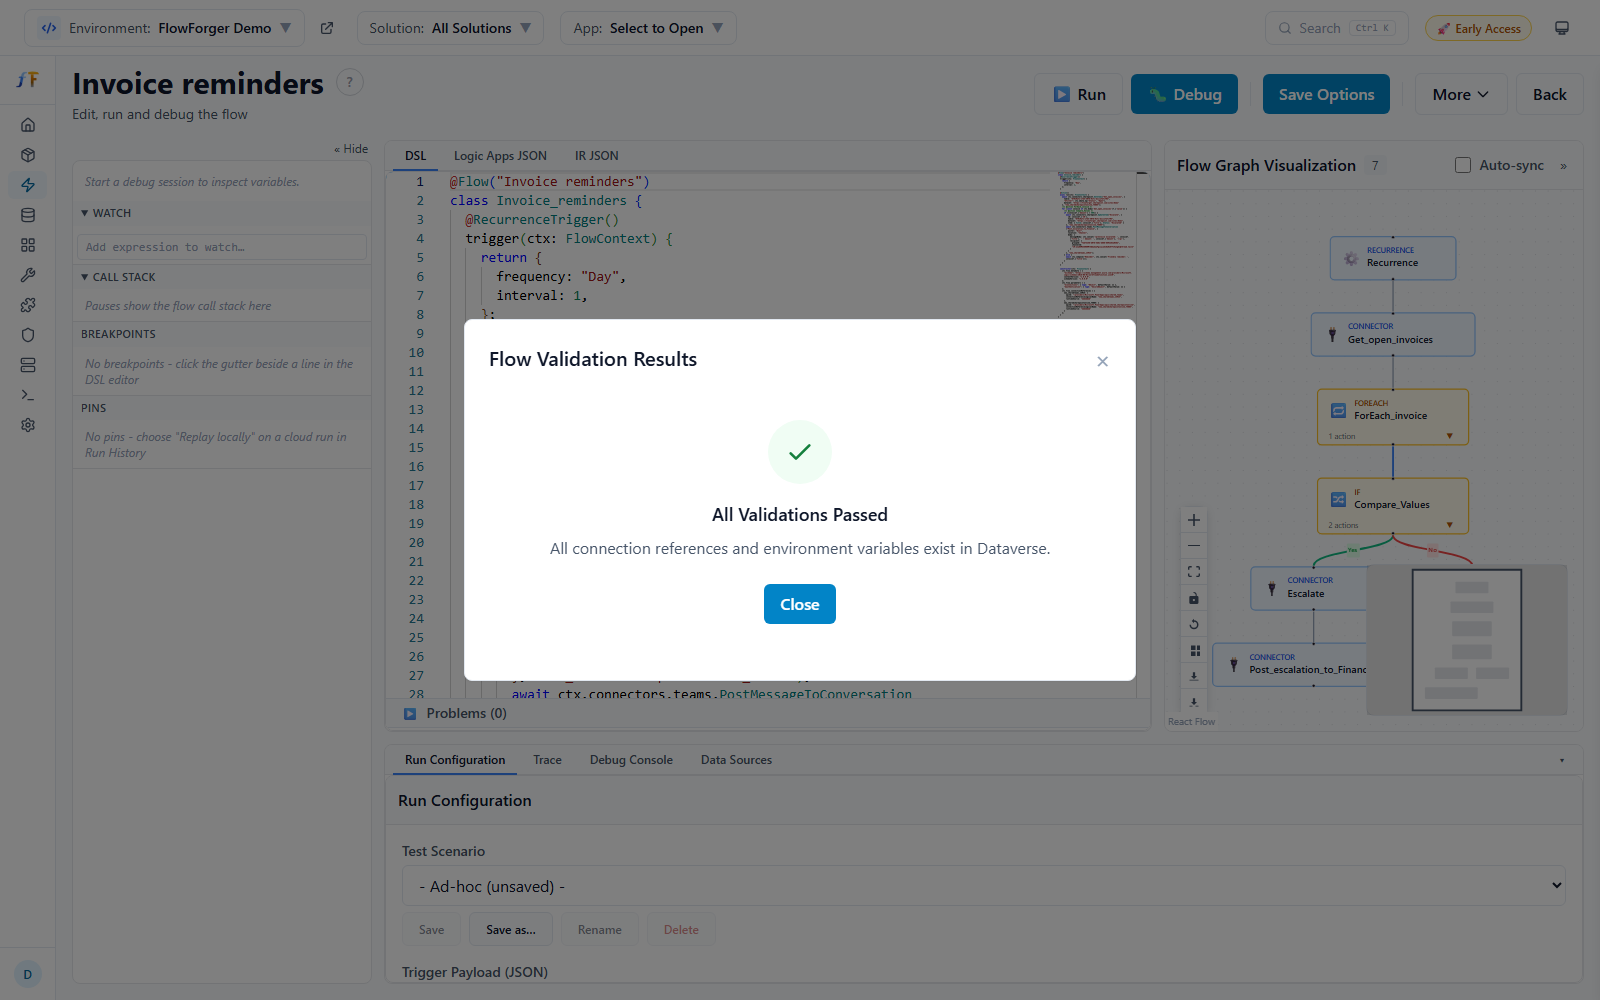 Validation Dialog showing missing connection references with reuse options.
DSL Optimization
Optimize analyzes the DSL and opens DSL Optimization Results:
- Proposed Changes -- Improvements you can check or uncheck individually.
- Hardcoded Values -- Literal values (such as site URLs or IDs) that can be moved into environment variables.
- Direct Connections -- Connections that can be converted into connection references.
- Warnings -- Potential issues, such as unused variables.
Click Apply Changes to update the DSL with the checked items.
Version History
Workspace flows have a version history. Versions are saved with Save Version in the More menu or Save as New Version in the Save Flow dialog. Each version records an incrementing number, an optional label (e.g. "v1.0") and message, the author and time, and a full snapshot of the DSL, IR, and Logic Apps JSON. The History button on the Flow Workspace list opens the same panel without opening the editor.
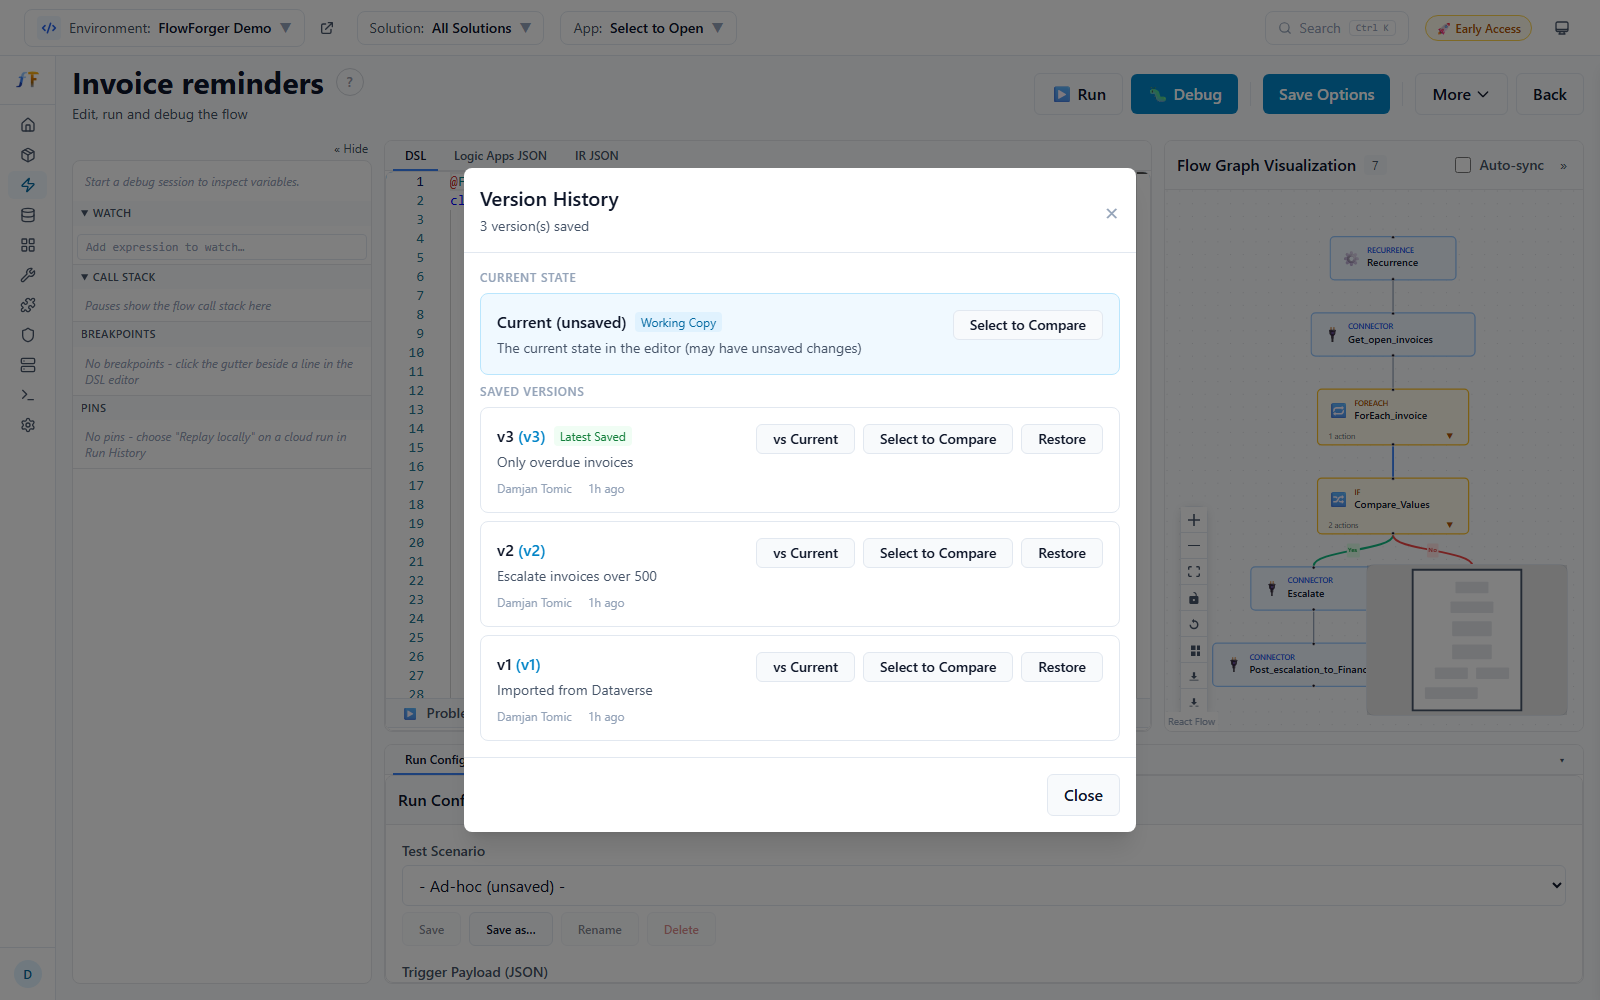 Version History panel showing saved versions with restore and compare actions.
The Version History panel shows:
- Current State -- The working copy in the editor (may have unsaved changes), marked Working Copy.
- Saved Versions -- Newest first, the latest marked Latest Saved, each with its number, label, message, author, and time.
Comparing versions
- Click Select to Compare on the first version (or on the current state).
- A bar shows the selection; Cancel clears it.
- Click Compare on the second version.
vs Current on a saved version compares it with the working copy directly. The Version Comparison viewer shows the two side by side (Split View) or Inline View, for the DSL code or the IR, and can be maximized.
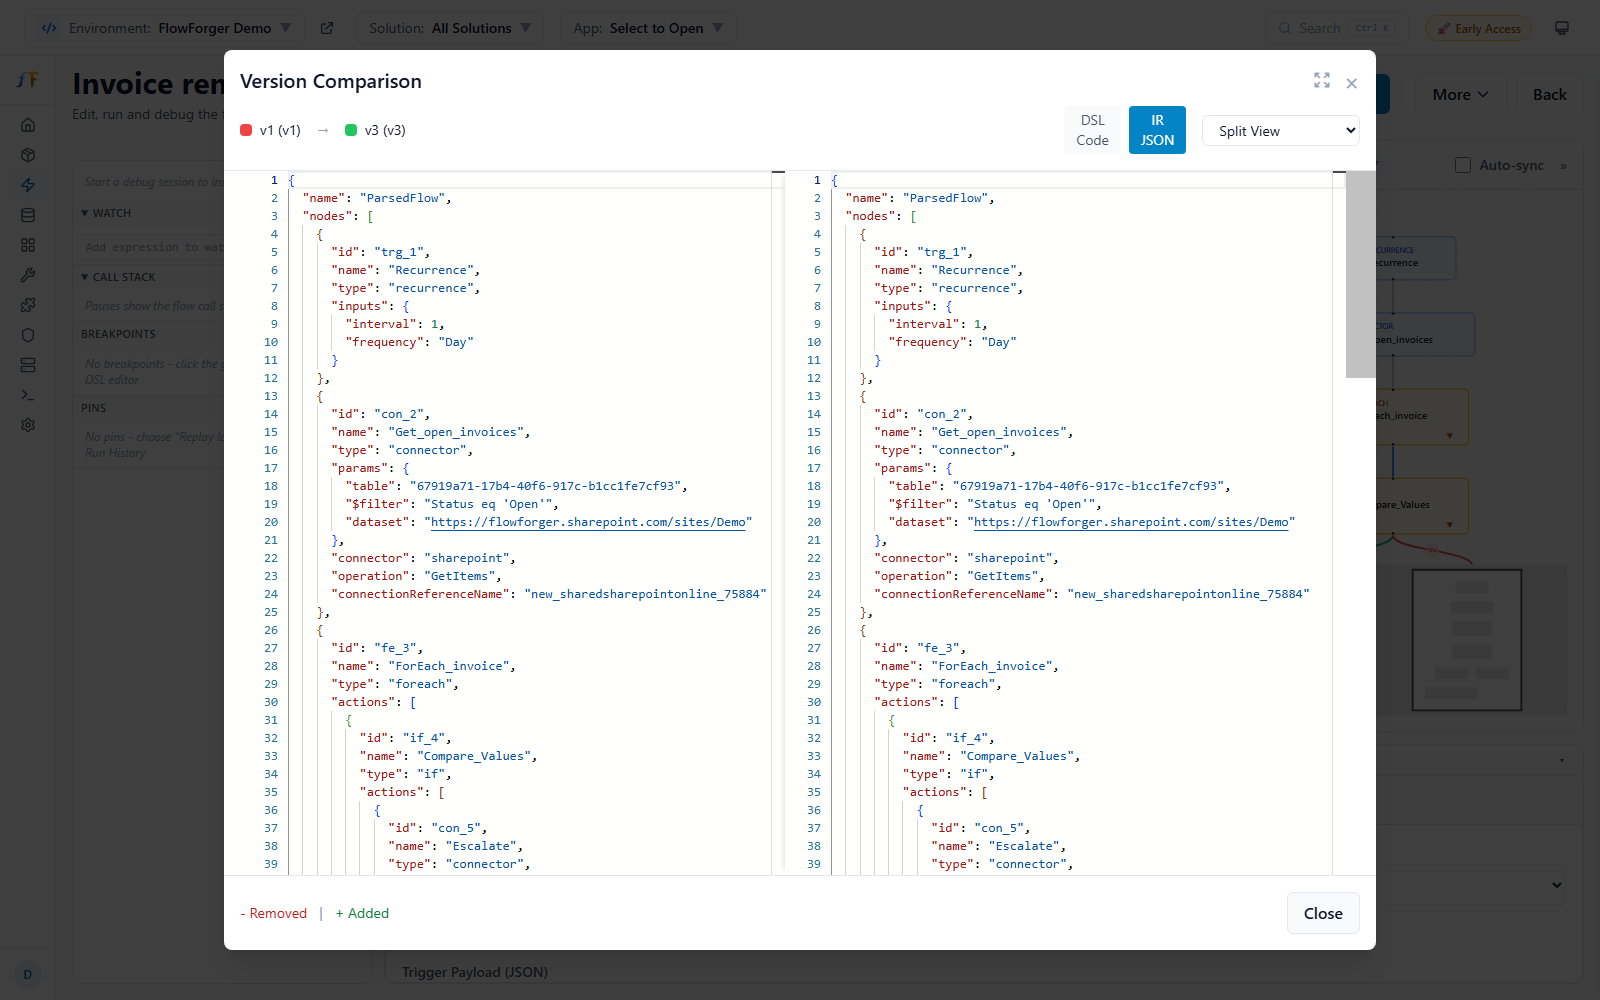 Version Comparison showing DSL differences between two versions.
Restoring a version
Click Restore on a saved version to replace the current flow with it, after a confirmation.
Source & Deployment Tracking
Source in the More menu shows where a workspace flow came from (New, Dataverse with its environment and workflow ID, or Migrated) and its deployment history: each deployment's environment, solution, type, time, and sync count, with the main target marked Primary.
Keyboard Shortcuts
The debugger shortcuts follow Visual Studio Code and work anywhere in the editor except while a dialog is open.
| Key | Action |
|---|---|
| F5 | Start a debug session; while paused, continue |
| Ctrl+F5 | Run without debugging. Press twice within 5 seconds (or click Run in the confirmation message), because Ctrl+F5 is also the browser's hard-reload key and a run calls connectors for real |
| Shift+F5 | Stop the session |
| Ctrl+Shift+F5 | Apply changes & continue (paused, with DSL edits) |
| F9 | Toggle a breakpoint at the cursor |
| F10 | Step Over |
| F11 | Step In |
| Shift+F11 | Step Out |
| Ctrl+Shift+F10 | Jump to the cursor line (Set Next Statement) |
| Ctrl+Shift+R | Reload the page (F5 does not reload in the editor) |
| Ctrl+K | Open the Command Palette |
In the Debug Console: Enter runs, Shift+Enter adds a line, ↑/↓ browse history.
The VS Code extension offers the same debugger, including Edit & Continue and Jump to Cursor, for .ff.ts files on your machine.