ERD Editor
The ERD (Entity Relationship Diagram) Editor lets you visualize and document table relationships in your Dataverse environment. You can create diagrams that show tables and how they relate to each other, then export the result as an image, as JSON, or in Mermaid, Draw.io, or DOT (Graphviz) format.
ERD List Page
Navigate to Data Model → ER Diagrams to manage your diagrams. The Entity Relationship Diagrams page shows all ERDs you have created in a sortable, filterable table.
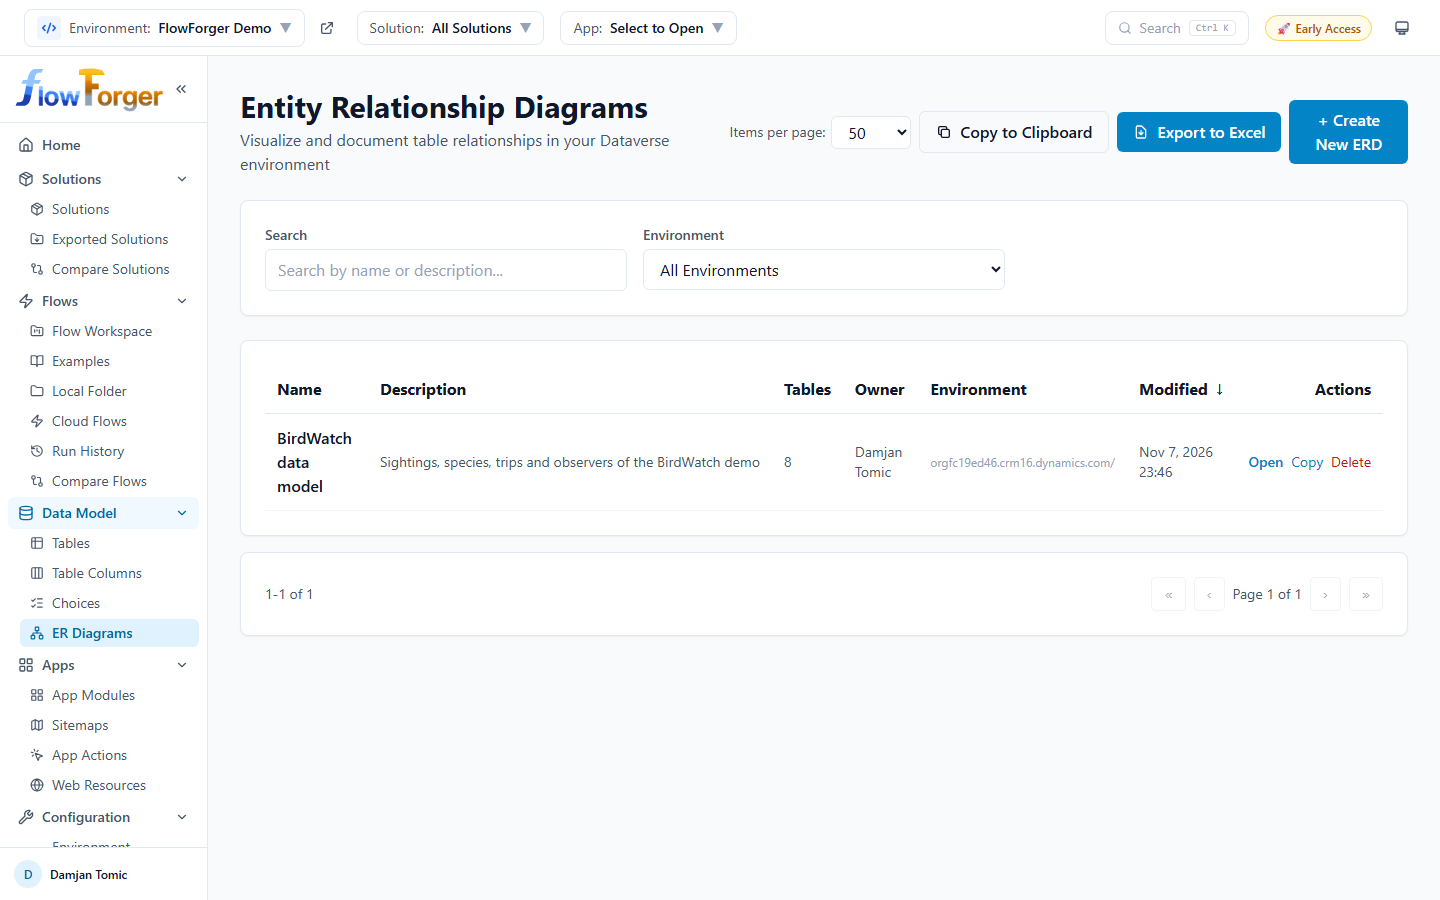 The ERD list page showing saved diagrams with filters and action buttons.
Note: You must select an environment from the top header before you can view or create ERDs.
Table Columns
| Column | Description |
|---|---|
| Name | The diagram's display name. |
| Description | An optional description of what the diagram documents. |
| Tables | The number of Dataverse tables included in the diagram. |
| Owner | The user who created the diagram (display name or email). |
| Environment | The Dataverse environment URL the diagram is associated with. |
| Modified | The date and time the diagram was last updated. |
The Name and Modified columns are sortable. Click a column header to sort.
Filters
A filter panel above the table provides:
- Search -- Filter by name or description text.
- Environment -- Filter by a specific Dataverse environment URL.
Filter selections are remembered in your browser.
Row Actions
Each row has three action buttons:
- Open -- Open the diagram in the ERD Editor canvas.
- Copy -- Duplicate the diagram. You will be prompted for a name for the copy.
- Delete -- Delete the diagram after a confirmation prompt.
Creating a New ERD
- Click the + Create New ERD button in the top right.
- A dialog appears with the following fields:
- Name (required) -- Enter a descriptive name for your diagram.
- Description (optional) -- Describe what the diagram represents.
- Environment -- Shows the currently selected environment (read-only).
- Click Create to create the diagram. The ERD Editor canvas opens directly.
Note: During early access you can create as many diagrams as you like. Once paid plans launch, the free plan includes one saved diagram; creating or copying more needs a paid plan, while diagrams you already have stay editable. See Pricing.
Export
The list can be exported to the clipboard or Excel.
ERD Editor Canvas
When you open an ERD, the full-screen editor loads with a dark-themed canvas for arranging tables and viewing relationships.
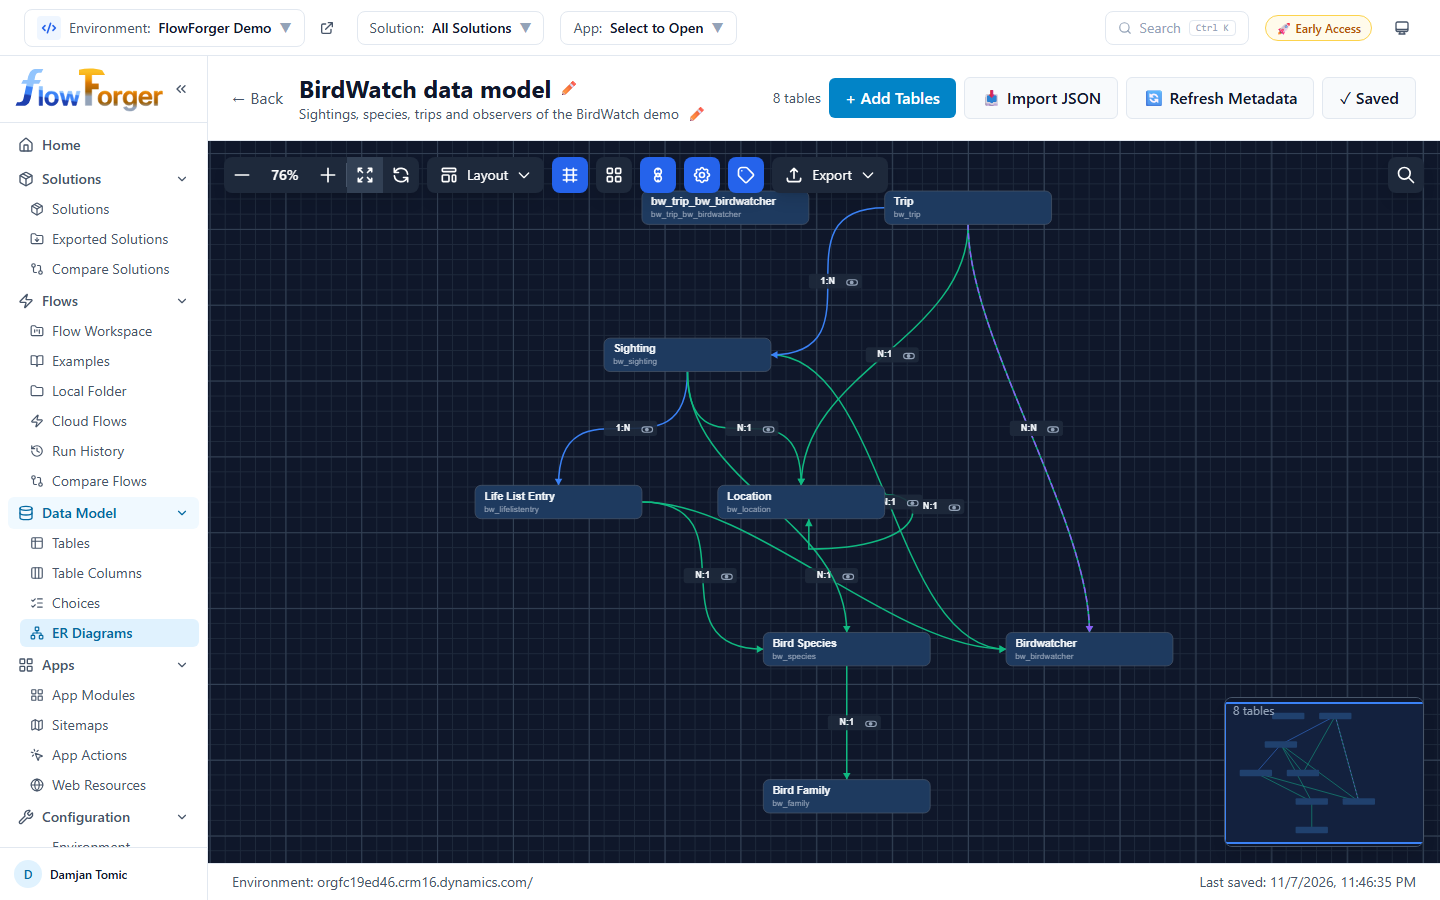 The ERD Editor canvas showing tables with relationships on a dark grid background.
Page Structure
The editor consists of three areas:
- Header bar -- Shows the diagram name (editable), description, table count, and action buttons.
- Canvas -- The main interactive area where tables and relationships are displayed.
- Status bar -- Shows the associated environment, an Unsaved changes marker when there is something to save, and the Last saved time.
Header Actions
The header bar provides the following controls:
| Button | Description |
|---|---|
| ← Back | Return to the ERD list page. |
| Rename (pencil icon) | Rename the diagram via a prompt. The new name is saved immediately. |
| Edit description (pencil icon or "+ Add description") | Add or edit the diagram's description. Saved immediately. |
| + Add Tables | Open the table selector sidebar to add Dataverse tables to the diagram. |
| 📥 Import JSON | Import an ERD from a previously exported JSON file. Creates a new diagram with the imported data. |
| 🔄 Refresh Metadata | Fetch fresh table definitions and relationships from Dataverse for all tables currently in the diagram. |
| 💾 Save | Save the diagram now (also Ctrl+S). Shows ✓ Saved when there is nothing to save. See Saving. |
Table Shapes
Each Dataverse table appears on the canvas as a compact rectangular shape.
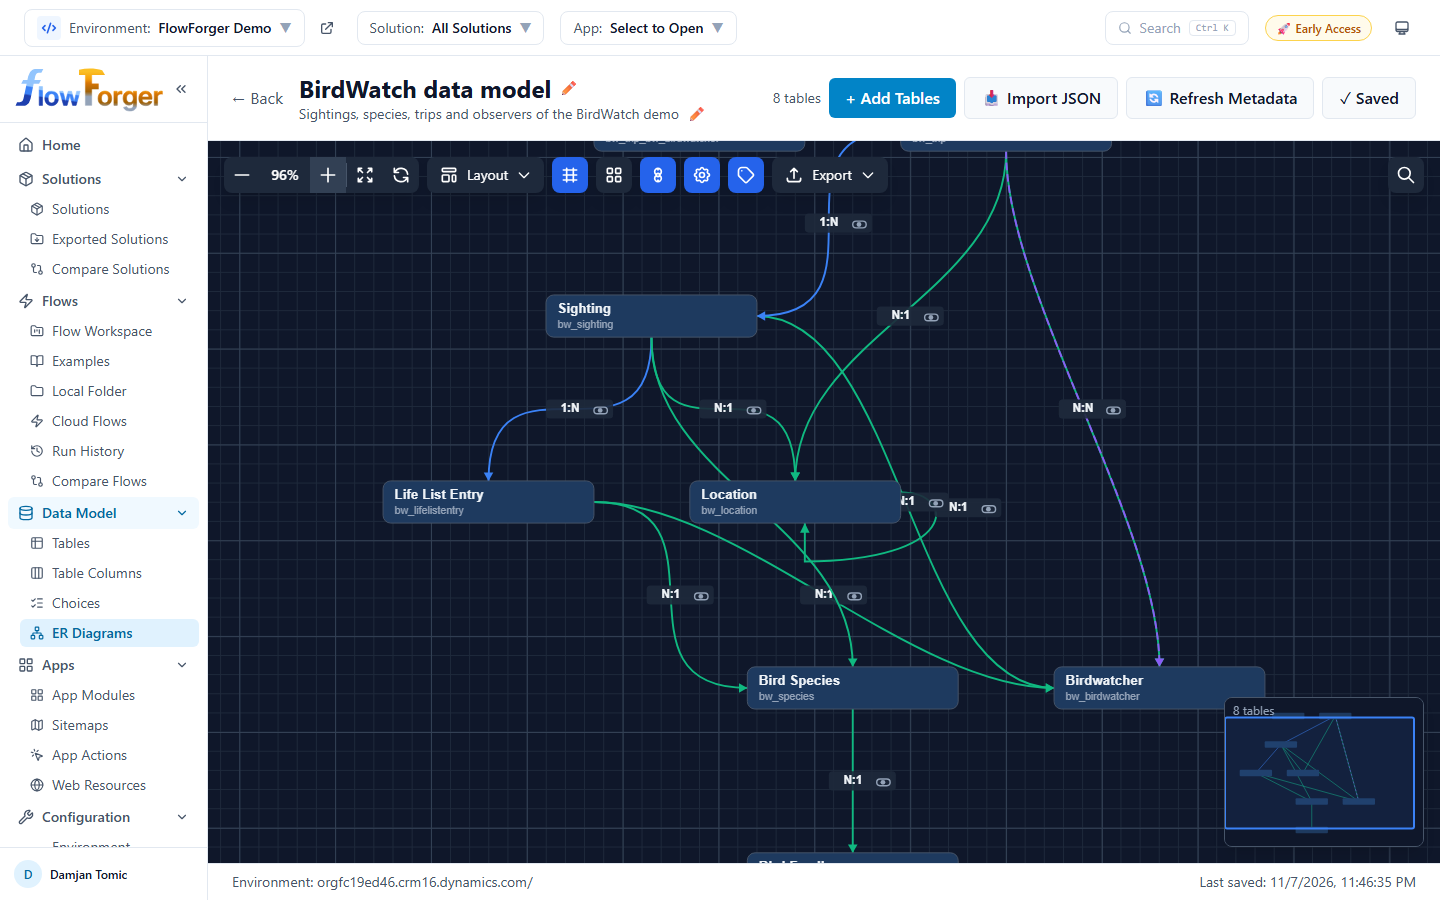 A table shape showing the display name and logical name.
Each shape shows:
- Display name -- The table's user-friendly name in bold text.
- Logical name -- The Dataverse logical name shown below in muted text.
Custom tables have a blue-tinted background to distinguish them from system tables. Columns are not drawn on the canvas; use Search to find a table by one of its column names.
Interacting with Tables
- Click -- Select the table. The border turns blue when selected.
- Shift+Click or Ctrl+Click -- Add the table to the current selection (multi-select).
- Drag -- Move the table to a new position on the canvas.
- Delete key -- Remove the selected table(s) from the diagram (with confirmation).
Relationship Lines
Relationships between tables are drawn as curved lines (cubic bezier curves) connecting the nearest edges of related tables.
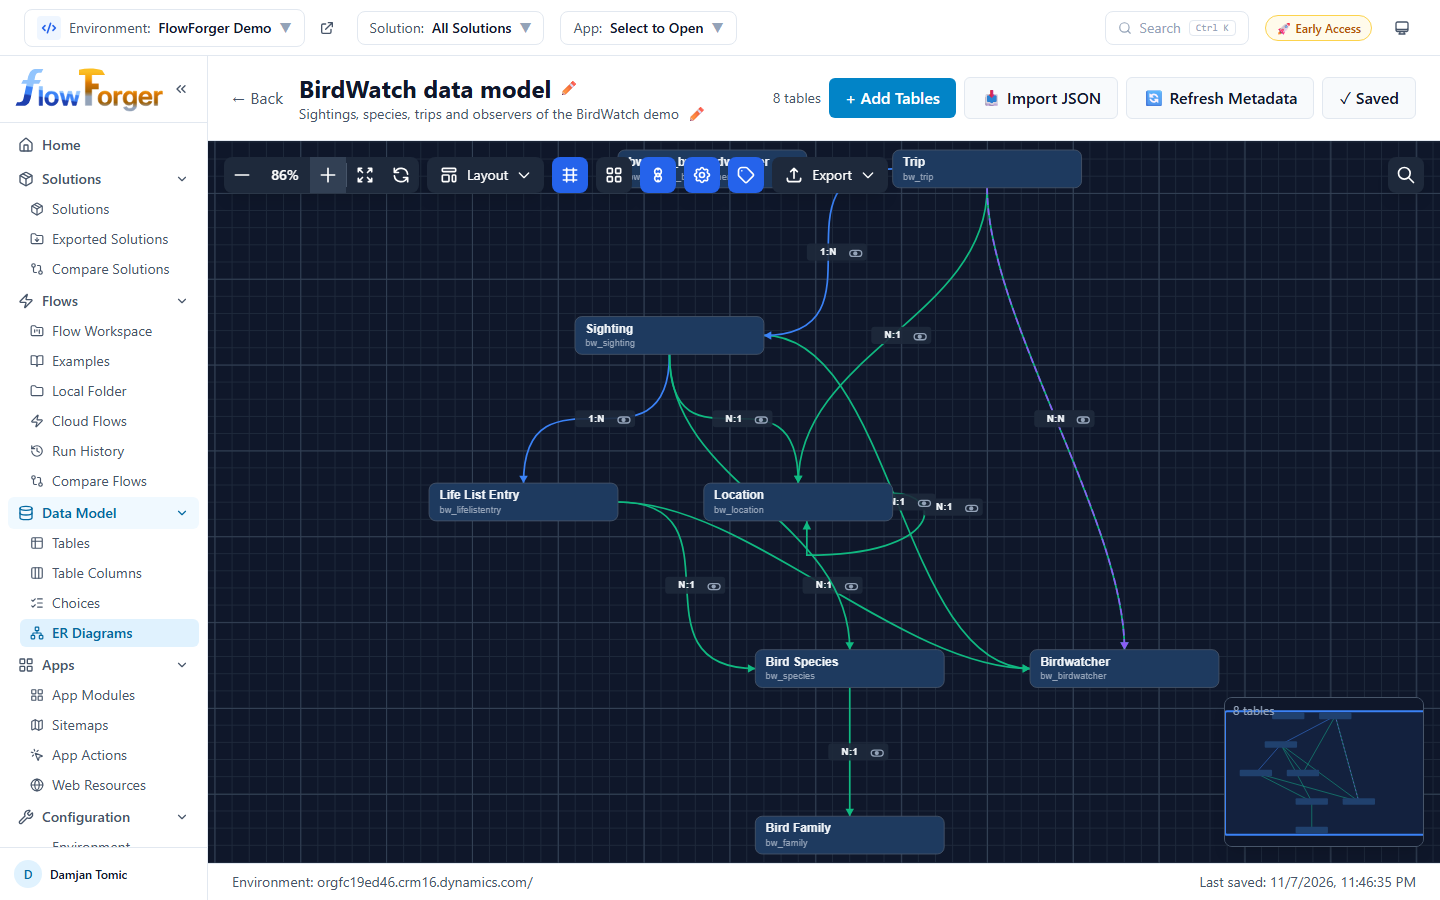 Relationship lines between tables showing cardinality labels and hide buttons.
Cardinality Labels
Each relationship line has a label at its midpoint showing the relationship type (labels can be turned off with the toolbar's edge labels toggle):
- 1:N -- One-to-many relationship (blue-tinted label).
- N:1 -- Many-to-one relationship (green-tinted label).
- N:N -- Many-to-many relationship (purple-tinted label, dashed line).
Arrowheads
Lines include directional arrowheads pointing toward the target table, making it clear which direction the relationship flows.
Self-Referencing Relationships
When a table has a relationship to itself (e.g., a parent-child hierarchy), the line draws a loop from the right side of the table down to the bottom. These can be toggled on or off using the toolbar.
Hiding Relationships
Each relationship label has a small eye icon button next to it. Click this button to hide that specific relationship from the diagram. Hidden relationships can be restored from the toolbar (see Hidden Relationships below).
Smart Routing
The canvas uses optimized edge routing that automatically calculates the best connection points (top, right, bottom, left) between tables based on their relative positions. When you move tables, the connection points are recalculated so lines stay clean.
Groups
Groups let you visually organize related tables by placing them inside a colored boundary.
Creating a Group
- Select one or more tables by clicking them (use Shift+Click or Ctrl+Click for multi-select).
- A selection counter appears at the bottom left showing how many tables are selected.
- Click the Group button next to the selection counter.
- Enter a name for the group in the prompt that appears.
- The group is created with a randomly assigned color from a predefined palette.
Group Behavior
- Groups appear as colored, semi-transparent rectangles behind their member tables.
- The group header shows the group name.
- Drag a group to move it along with all its member tables.
- Double-click a group to collapse it, hiding all its member tables. Double-click again to expand.
- Right-click a group to delete it (with confirmation). Deleting a group does not remove its tables from the diagram.
Toolbar
The toolbar is positioned at the top left of the canvas and provides controls for canvas navigation and display options.
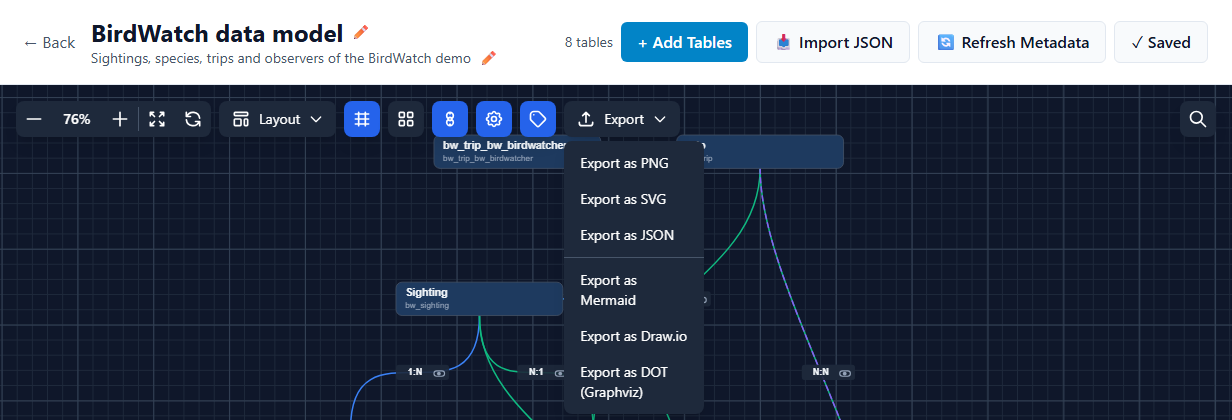 The ERD Editor toolbar with zoom, layout, grid, and export controls.
Zoom Controls
| Control | Description |
|---|---|
| - (Zoom Out) | Decrease zoom level. Also available via scroll down. |
| Zoom percentage | Shows the current zoom level (e.g., "100%"). |
| + (Zoom In) | Increase zoom level. Also available via scroll up. |
| Fit to Content | Automatically zoom and pan to fit all tables in the viewport. |
| Reset Zoom | Return to 100% zoom. |
Layout Controls
Click the Layout dropdown button to access automatic layout algorithms:
- Top to Bottom -- Arrange tables in a hierarchical layout flowing from top to bottom.
- Left to Right -- Arrange tables in a hierarchical layout flowing from left to right.
The layout is calculated in the background, so the page stays responsive. A spinner appears on the button while it runs.
Grid and Snap
- Grid toggle -- Show or hide the background grid. The grid displays both minor (20px) and major (100px) gridlines. The grid automatically hides at very low zoom levels (below 30%).
- Snap to Grid toggle -- When enabled, tables snap to the nearest grid intersection when dropped after dragging.
Display Toggles
Three toggle buttons control which relationships are drawn and how (hover a button to see whether it is ON or OFF):
- Self-referencing edges -- Show or hide relationships from a table to itself. Useful for decluttering diagrams where self-referencing lookups create visual noise.
- System relationships -- When turned off, only custom relationships are shown.
- Edge labels -- Show or hide the cardinality labels (and their hide buttons) on the relationship lines.
Hidden Relationships
When you hide one or more relationships, an amber Hidden button appears in the toolbar showing the count of hidden relationships. Click it to open a dropdown list of all hidden relationships. Each entry shows:
- The relationship type badge (1:N, N:1, or N:N).
- The display name (e.g., "Account -> Contact").
- A restore (eye) icon.
Click any entry to restore that relationship to the diagram.
Export
Click the Export dropdown to access export options:
- Export as PNG -- Download the diagram as a PNG image. The export captures all tables at full resolution (2x pixel ratio) regardless of the current viewport.
- Export as SVG -- Download the diagram as an SVG file with properly styled table shapes, relationship lines, and labels.
- Export as JSON -- Download the full ERD data as a JSON file, including table definitions, relationships, layout positions, groups, and filters. This file can be imported into another ERD using the header's Import JSON button.
- Export as Mermaid -- Download the diagram as a Mermaid ER diagram, for example to paste into Markdown documentation.
- Export as Draw.io -- Download a file you can open and keep editing in draw.io (diagrams.net).
- Export as DOT (Graphviz) -- Download the diagram in Graphviz DOT format.
Search
The search feature helps you find specific tables or columns in large diagrams.
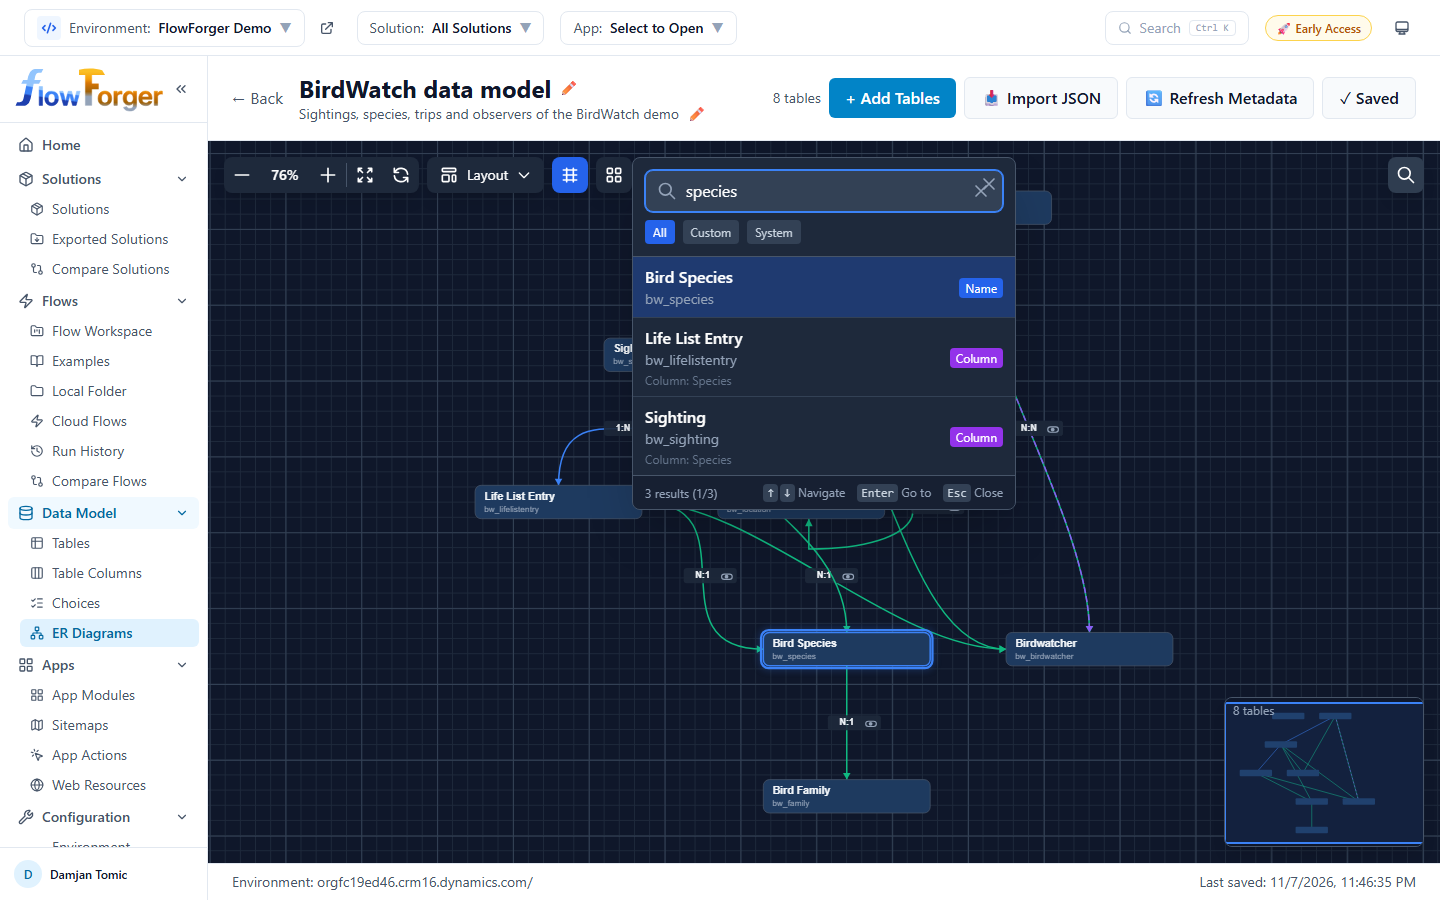 The search overlay showing results for a query, with match type badges.
Opening Search
- Click the search icon button in the top right corner of the canvas.
- Or press Ctrl+F (Cmd+F on Mac).
Using Search
- Type your query in the search input. Results update as you type.
- Use the filter buttons below the search input to narrow results:
- All -- Show all matching tables.
- Custom -- Show only custom tables.
- System -- Show only system tables.
- Each result shows the table's display name, logical name, and a match type badge:
- Name (blue) -- The query matched the table's display name.
- Logical (green) -- The query matched the logical name.
- Column (purple) -- The query matched a column name within the table.
Navigating Results
- Use Arrow Up and Arrow Down keys to move between results.
- Press Enter to navigate to the selected result. The canvas pans to center on that table and selects it.
- Click any result directly to navigate to it.
- Press Escape to close the search overlay.
The footer shows the total number of results and your current position (e.g., "3/12").
Adding Tables
Click + Add Tables in the header to open the table selector sidebar.
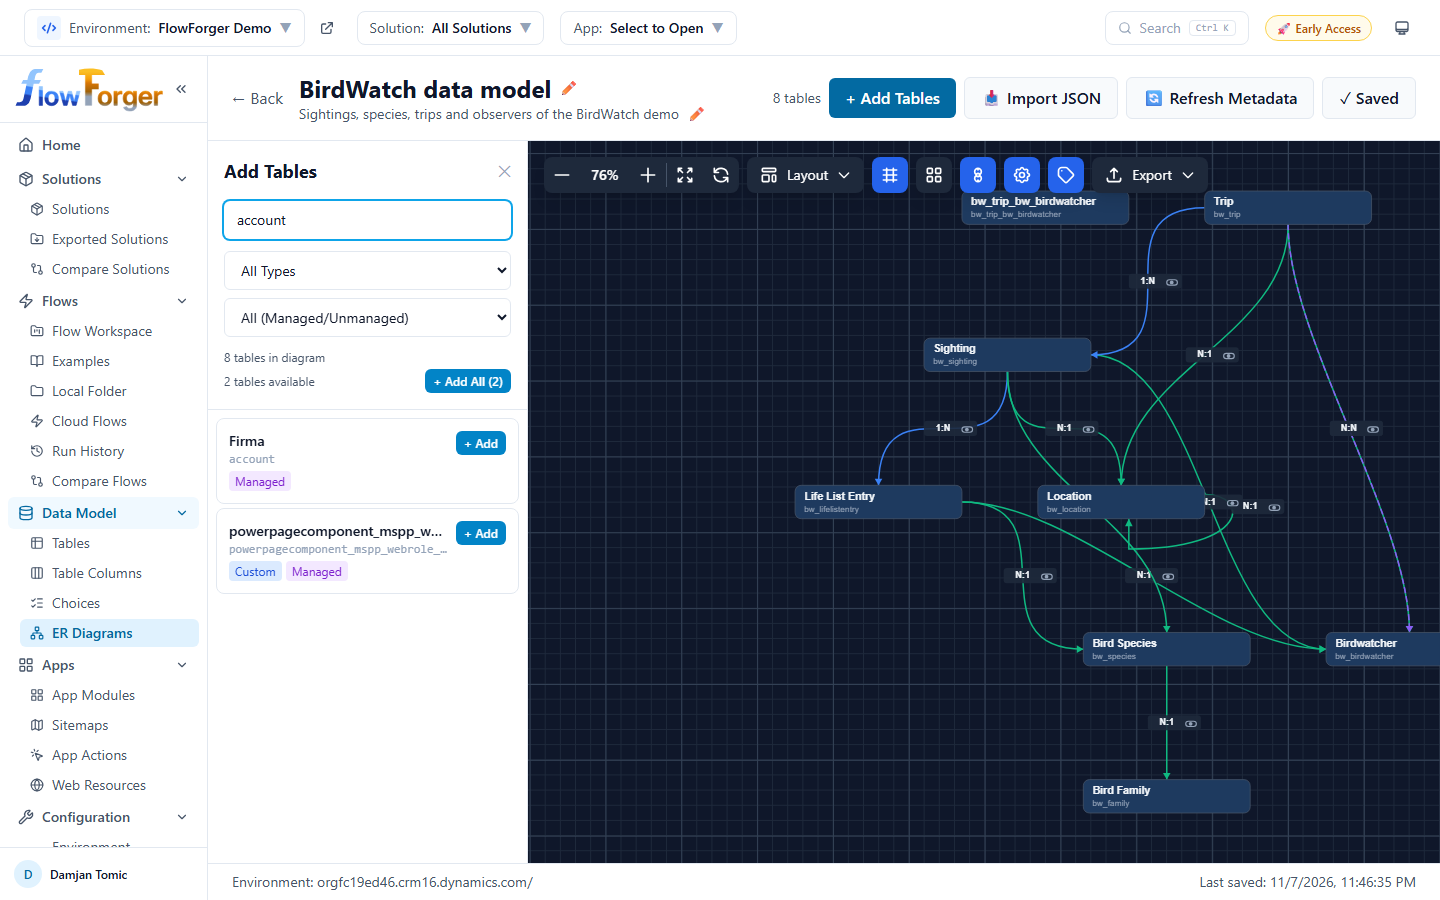 The table selector sidebar showing available Dataverse tables with filters.
The Add Tables sidebar shows all Dataverse tables available in the current environment (or in the selected solution, if one is chosen). Tables already in the diagram are excluded from the list.
Filters
- Search -- Filter by display name or logical name.
- Type -- All Types, Custom Only, or System Only.
- Managed -- All (Managed/Unmanaged), Managed Only, or Unmanaged Only.
Adding Tables
Click a table in the list to add it to the diagram. FlowForger Portal fetches the table's definition and relationships from Dataverse, then adds it to the canvas. Relationships to tables already in the diagram are created automatically.
To add every table that matches the current filters at once, click + Add All (N). The button shows the progress (for example 12/40) while the tables are added.
The sidebar also shows how many tables are already in the diagram and how many are available. Click the X button or click outside the sidebar to close it.
Minimap
The minimap is a small overview panel in the bottom right corner of the canvas.
- It shows all tables as small colored rectangles, proportionally positioned.
- Selected tables are highlighted.
- Relationship lines are shown as thin lines between the table rectangles.
- A semi-transparent rectangle indicates the current viewport area.
- Click and drag on the minimap to pan the main canvas.
- Press the M key to toggle the minimap on or off.
Keyboard Shortcuts
| Shortcut | Action |
|---|---|
| Ctrl+S / Cmd+S | Save the diagram |
| Ctrl+F / Cmd+F | Open search overlay |
| Ctrl+A / Cmd+A | Select all tables |
| Delete / Backspace | Remove selected table(s) from diagram |
| Escape | Clear selection / Close search |
| M | Toggle minimap visibility |
| Shift+Click on canvas | Start selection rectangle |
| Shift+Click / Ctrl+Click on table | Add to selection |
| Scroll wheel | Zoom in / out |
| Drag canvas background | Pan the viewport |
Saving
Diagrams are saved to your FlowForger Portal account:
- Auto-save -- While there are unsaved changes (moved tables, added or removed tables, groups, hidden relationships, and the self-referencing and system relationship toggles), the diagram is saved automatically every 60 seconds.
- Save now -- Click 💾 Save in the header or press Ctrl+S (Cmd+S on Mac).
- Leaving the editor -- Going back to the list saves pending changes. If you try to close or reload the browser tab with unsaved changes, the browser asks you to confirm.
- Name and description -- Saved immediately when you change them.
The status bar shows Unsaved changes while something is pending, and the Last saved time.